Nick LaVassar: Difference between revisions
imported>Lavassar No edit summary |
imported>Lavassar |
||
| (9 intermediate revisions by the same user not shown) | |||
| Line 39: | Line 39: | ||
* Trianomaly - Shift S cone: <math>S(\lambda)_a = S(\lambda +\Delta \lambda_S)</math> | * Trianomaly - Shift S cone: <math>S(\lambda)_a = S(\lambda +\Delta \lambda_S)</math> | ||
We can convert from LMS to opponent color space using the following | We can convert from LMS to opponent color space using the following transform: | ||
: <math> | |||
\begin{bmatrix} | |||
WS(\lambda) \\ | WS(\lambda) \\ | ||
YB(\lambda) \\ | YB(\lambda) \\ | ||
RG(\lambda) \end{bmatrix} = \begin{bmatrix} | RG(\lambda) | ||
0.600 & 0.400 & 0.000 | \end{bmatrix} = | ||
0.240 & 0.105 & 0.700 | \begin{bmatrix} | ||
1.200 & 1.600 & 0.400 | 0.600 & 0.400 & 0.000 \\ | ||
\end{bmatrix} | 0.240 & 0.105 & 0.700 \\ | ||
1.200 & 1.600 & 0.400 \\ | |||
\end{bmatrix} | |||
\begin{bmatrix} | |||
L(\lambda) \\ | L(\lambda) \\ | ||
M(\lambda) \\ | M(\lambda) \\ | ||
S(\lambda) \end{bmatrix} | S(\lambda) | ||
\end{bmatrix} | |||
</math> | |||
Then, by projecting the opponent color representation of LMS onto the spectral values of the primary phosphors, we arrive at a matrix conversion from RGB to opponent color space: | |||
: <math> | |||
\Gamma = | |||
\begin{bmatrix} | |||
WS_R & WS_G & WS_B \\ | |||
BY_R & BY_G & BY_B \\ | |||
RG_R & RG_G & RG_B \\ | |||
\end{bmatrix} | |||
</math> | </math> | ||
To obtain a \Gamma representation for given CVD, we simply insert the appropriately morphed cone distribution function and recompute the projection. The following functions are essentially linear interpolations between the L and M cones that also morph the functions to approximately overlap one another at either end of a full shift. Thus, these functions define simulated severities of a deuteranomaly or protanomaly. | |||
* <math> L_a(\lambda) = \alpha L(\lambda) + (1-\alpha) * 0.96 * {Area_L} / {Area_M} * M(\lambda) </math> | |||
* <math> M_a(\lambda) = \alpha M(\lambda) + (1-\alpha) * 1.042 * {Area_M} / {Area_L} * L(\lambda) </math> | |||
Tritanomaly is modeled by simply linearly shifting the S cone distribution function. | |||
* <math> S_a(\lambda) = S(\lambda + \Delta\lambda_S) </math> | |||
Now, having precomputed \Gamma's for each of the CVDs of interest, we can transform each RGB pixel value into the opponent color representation for the color deficient individual. Then, we can return to a trichromatic representation of that signal in RGB space by multiply by the inverse of the opponent color transformation for someone with normal color perception. | |||
: <math> | |||
\begin{bmatrix} | |||
R_s \\ | |||
G_s \\ | |||
B_s | |||
\end{bmatrix} = | |||
\Gamma_{normal}^{-1} \Gamma_{CVD} | |||
\begin{bmatrix} | |||
R \\ | |||
G \\ | |||
B | |||
\end{bmatrix} | |||
</math> | |||
== Implementation == | == Implementation == | ||
The method described was implemented on an iPhone to augment the device's camera feed in real time. As a result, the simulation is highly portable and easily distributed. | The method described was implemented on an iPhone to augment the device's camera feed in real time. As a result, the simulation is highly portable and easily distributed. | ||
Since the color transformation matrices do not vary per pixel in a processed image, it was possible to apply the operations in parallel on the iPhone's GPU using the OpenGL shading language GLSL. Without parallelizing the computations on the GPU, interactive framerates would not have been achievable on a device with such limited computation resources. | |||
= Results = | = Results = | ||
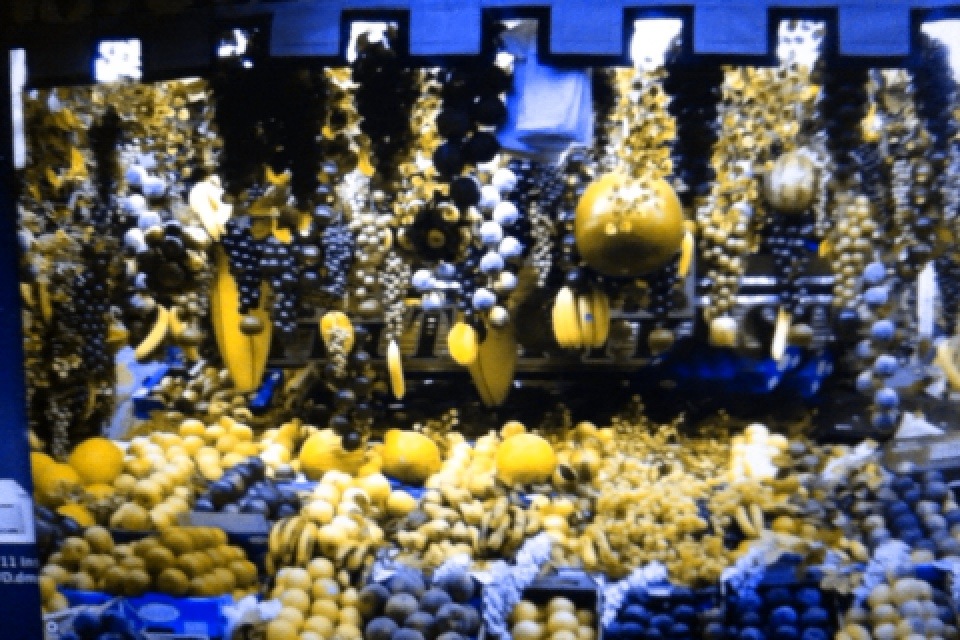
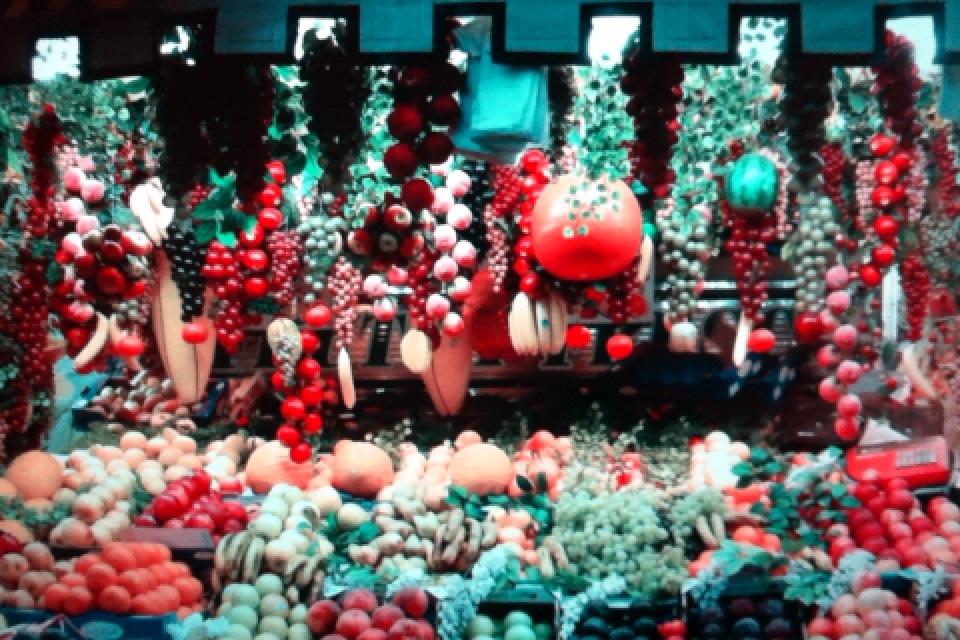
The following images demonstrate the effect of the three types of dichromacy that can be simulated with the previously discussed algorithm. Note how deuteropes and protanopes have roughly the same experience (difficulty distinguishing between red and green). | |||
== Normal Color Vision == | |||
[[File: Nocvd.jpg | Figure 1]] | |||
== Deuteranope == | |||
[[File: Deut.jpg | Figure 2]] | |||
== Protanope == | |||
[[File: Prot.jpg | Figure 3]] | |||
== Tritanope == | |||
[[File: Trit.jpg | Figure 4]] | |||
= Conclusions = | = Conclusions = | ||
Applying the previously described color vision deficiency simulation to a realtime device yielded a very interesting and hopefully useful tool. The simulation can be used to entertain and educate people about CVDs. It can also assist trichromatic designers | Applying the previously described color vision deficiency simulation to a realtime device yielded a very interesting and hopefully useful tool. The simulation can be used to entertain and educate people about CVDs. It can also assist trichromatic designers in creating content for dichromates. | ||
When using the tool it is important to remember that it is impossible to say that what you are seeing exactly reproduces the world as it is seen by any given dichromate. This simulation gives one of an infinite number of actual color representations. One should focus on the relationships between colors and how they become harder to distinguish not on the actual colors on the screen. | |||
= References = | = References = | ||
<span id="fernandes">[1]</span>[http://www.inf.ufrgs.br/~oliveira/pubs_files/CVD_Simulation/Machado_Oliveira_Fernandes_CVD_Vis2009_final.pdf Gustavo M. Machado, Manuel M. Oliveira, and Leandro A. F. Fernandes "A Physiologically-based Model for Simulation of Color Vision Deficiency". IEEE Transactions on Visualization and Computer Graphics. Volume 15 (2009), Number 6, November/December 2009. pp. 1291-1298.] | <span id="fernandes">[1]</span>[http://www.inf.ufrgs.br/~oliveira/pubs_files/CVD_Simulation/Machado_Oliveira_Fernandes_CVD_Vis2009_final.pdf Gustavo M. Machado, Manuel M. Oliveira, and Leandro A. F. Fernandes "A Physiologically-based Model for Simulation of Color Vision Deficiency". IEEE Transactions on Visualization and Computer Graphics. Volume 15 (2009), Number 6, November/December 2009. pp. 1291-1298.] | ||
<span id="brettel">[2]</span>[http://www.opticsinfobase.org/abstract.cfm?URI=josaa-14-10-2647 Hans Brettel, Françoise Viénot, and John D. Mollon, "Computerized simulation of color appearance for dichromats," J. Opt. Soc. Am. A 14, 2647-2655 (1997)] | |||
<span id="vischeck">[3]</span>[http://www.vischeck.com Vischeck] | |||
= Appendix I - Code and Data = | = Appendix I - Code and Data = | ||
http://itunes.apple.com/us/app/neweyes/id425311528?mt=8&ls=1 | |||
(Link may not be active just yet) | |||
[http://white.stanford.edu/teach/index.php/Psych221-Projects-2011#Projects_Wiki_Pages Back to Main Page] | [http://white.stanford.edu/teach/index.php/Psych221-Projects-2011#Projects_Wiki_Pages Back to Main Page] | ||
Latest revision as of 03:56, 21 March 2011
Introduction
Color vision deficiency (often called "colorblindness") affects hundreds of millions of people around the world. The deficiency is sex linked: approximately 8% of men have a CVD versus only 0.5% of females. This project aims to simulate the most common types of CVDs for people with normal color perception. The simulation will be run in realtime on an iOS device.
Background
Color vision deficiencies are characterized by reduced sensitivity to color as a result of anomalies in the eye's color receptors (called cones). In extremely rare cases, the cones in the eye are either completely absent or totally dysfunctional which results in monochromacy (no color perception). When only one cone is missing a person is said to be dichromatic. The most common CVDs are caused by a shift in the sensitivity of one of the types of cone in the eye and is known as anomalous trichromacy.
CVDs are classified according to which cone type is affected:
- Protanomaly - L cone sensitivity is defective.
- Deuteranomaly - M cone sensitivity is defective.
- Tritanomaly - S cone sensitivity is defective.
Likewise, someone with dichromatic vision is completely missing either their L, M or S cones, and is called either a protanope, deuteranope, or tritanope, respectively.
Protanopia and deuteranopia reduce senstivity to red-green colors, while tritanopia reduces sensitivity to blue-yellow colors.
Methods
Overview
Simulation steps are as follows:
- Precompute matrices mapping from RGB to opponent color space for range of CVD types and severities.
- Linearize RGB values from input camera in preparation for calculations in LMS space.
- Multiply linear RGB value with opponent CVD matrix to get opponent color space representation of what a color deficient person receives as input to their neural pathways.
- Multiply deficient opponent colorspace representation by the inverse opponent matrix conversion of a normal color perceiver to get trichromat representation.
- Reapply gamma and display on screen.
Computations
Anomalous trichromacy can be simulated by shifting the sensitivity of the L, M, and S cones in the following ways^1:
- Protanomaly - Shift L cone toward M cone
- Deuteranomaly - Shift M cone toward L cone
- Trianomaly - Shift S cone:
We can convert from LMS to opponent color space using the following transform:
Then, by projecting the opponent color representation of LMS onto the spectral values of the primary phosphors, we arrive at a matrix conversion from RGB to opponent color space:
To obtain a \Gamma representation for given CVD, we simply insert the appropriately morphed cone distribution function and recompute the projection. The following functions are essentially linear interpolations between the L and M cones that also morph the functions to approximately overlap one another at either end of a full shift. Thus, these functions define simulated severities of a deuteranomaly or protanomaly.
Tritanomaly is modeled by simply linearly shifting the S cone distribution function.
Now, having precomputed \Gamma's for each of the CVDs of interest, we can transform each RGB pixel value into the opponent color representation for the color deficient individual. Then, we can return to a trichromatic representation of that signal in RGB space by multiply by the inverse of the opponent color transformation for someone with normal color perception.
Implementation
The method described was implemented on an iPhone to augment the device's camera feed in real time. As a result, the simulation is highly portable and easily distributed.
Since the color transformation matrices do not vary per pixel in a processed image, it was possible to apply the operations in parallel on the iPhone's GPU using the OpenGL shading language GLSL. Without parallelizing the computations on the GPU, interactive framerates would not have been achievable on a device with such limited computation resources.
Results
The following images demonstrate the effect of the three types of dichromacy that can be simulated with the previously discussed algorithm. Note how deuteropes and protanopes have roughly the same experience (difficulty distinguishing between red and green).
Normal Color Vision
Deuteranope
Protanope
Tritanope
Conclusions
Applying the previously described color vision deficiency simulation to a realtime device yielded a very interesting and hopefully useful tool. The simulation can be used to entertain and educate people about CVDs. It can also assist trichromatic designers in creating content for dichromates.
When using the tool it is important to remember that it is impossible to say that what you are seeing exactly reproduces the world as it is seen by any given dichromate. This simulation gives one of an infinite number of actual color representations. One should focus on the relationships between colors and how they become harder to distinguish not on the actual colors on the screen.
References
[3]Vischeck
Appendix I - Code and Data
http://itunes.apple.com/us/app/neweyes/id425311528?mt=8&ls=1
(Link may not be active just yet)


