Nik: Difference between revisions
imported>Psych204B No edit summary |
imported>Psych204B No edit summary |
||
| Line 71: | Line 71: | ||
[[File:NikFigure11.gif]] | [[File:NikFigure11.gif]] | ||
[[File:NikFigure12. | [[File:NikFigure12.gif]] | ||
[[File:NikFigure13. | [[File:NikFigure13.gif]] | ||
[[File:NikFigure14. | [[File:NikFigure14.gif]] | ||
<gallery caption="Motion Graphs for Final 4 Subjects" widths="400px" perrow="4"> | <gallery caption="Motion Graphs for Final 4 Subjects" widths="400px" perrow="4"> | ||
File:NikFigure11. | File:NikFigure11.gif|Figure 11. Subject BH. | ||
File:NikFigure12. | File:NikFigure12.gif|Figure 12. Subject DD. | ||
File:NikFigure13. | File:NikFigure13.gif|Figure 13. Subject KU. | ||
File:NikFigure14. | File:NikFigure14.gif|Figure 14. Subject ML. | ||
</gallery> | </gallery> | ||
== Measuring retinotopic maps == | == Measuring retinotopic maps == | ||
Revision as of 23:43, 3 June 2013
Back to Psych 204 Projects 2013
Neural Correlates of Environmental Valuation: Background
The best method to capture the comprehensive value of environmental goods and services is a matter of contentious debate. Assessing environmental goods solely on the monetary potential of their natural resources as products and raw materials surely misses a large portion of the utility that humans derive from them. These benefits frequently fall outside the bounds of the marketplace, but an attempt to place them in an economic framework is necessary in order to arrive at some relative, scalable measure of their importance and value to the average citizen as public goods.
However, the majority of citizens are not directly involved in the purchase and management of public goods, necessitating the introduction of proxy measures such as surveys to derive these values (1). The contingent valuation (CV) survey method has been widely used by environmental economists – perhaps most visibly in its early days after the Exxon Valdez oil spill – as a survey method of assessing the nonmarket value of natural resources through respondents' willingness-to-pay (WTP) to prevent their loss or repair damages (2). Yet, the choices that individuals make in CV surveys are hypothetical, leading to problems with incentive compatibility and a disparity between their stated and revealed preferences (3). Moreover, survey responses in environmental valuation methods are subject to what Kahneman terms "affective valuation" (4), and are understood best not as true economic preferences, but as as expressions of emotion and attitudes. A large literature describes the seemingly irrational valuation decisions that plague environmental valuation techniques: "protest zeroes" where respondents refuse to put a price on the natural resource (5), stated WTP that is determined by the actions that damaged an environmental resource, rather than the value of the resource itself (1), and quantity insensitivity, where scaling the resource does not alter WTP (6). Jonathan Baron posits that environmental resources are often "protected values": highly resistant to economic tradeoffs, they elicit moral outrage when they are placed within a market framework (7).
To assess the degree of influence that affect has over WTP during environmental valuation, we designed a novel incentive-compatible donation task for functional MRI in order to identify the neural correlates of the emotional and cognitive responses involved in the decision process. The task elicited participants' willingness to pay to protect threatened state and national parks from proposed developmental land uses. We tested several predictions:
(i) Iconic natural landscapes would elicit activation in structures correlated with positive affect such as the ventral striatum
(ii) Destructive land uses would elicit activation in structures correlated with negative affect such as the anterior insula
(iii) WTP would be determined more, as Peter Diamond asserted, by response to the threatening land use than response to the resource itself (1)
(iv) Respondents with stronger pro-environmental attitudes, as measured by Dunlap's revised New Ecological Paradigm scale (8), would donate more frequently
Methods
Selection of Stimuli
In order to assess affective response and subjective perceptions of our stimulus set, we performed a pair of online surveys via SurveyMonkey to determine which parks (n=36) and land uses (n=29) to use in the final task. Respondents of Survey 1 rated various photographs of parks on 7-point Likert scales in terms of affect (valence/arousal), familiarity, and iconicness. Respondents of Survey 2 rated uses on valence/arousal, moral outrage, and perceived destructiveness to the park. Additionally, respondents of Survey 2 were shown place/use combinations and asked to provide hypothetical WTP. This data allowed derivation of our stimulus set of 24 places and 24 uses. The 12 most iconic and 12 least iconic places and 12 most destructive and 12 most conservative uses were utilized in the study; parks and uses with multiple image variants in the survey used the image that scored closest to the mean in valence and arousal for that park or use in the final two counterbalanced stimulus sets.
WTP Donation Task
Participants were endowed with $24 at the beginning of the study, from which a randomized donation decision would be deducted. In a series of 72 trials, participants were first shown a park, then a proposed use for a quarter of the land (e.g., mining), and then asked if they would donate a specific amount (e.g., $15) to help avert this use (Figure 1). Parks and uses were chosen from our pilot survey data, and amount varied between $1 and $18, and was binned into low ($1-6)/medium ($7-12)/high ($13-18) categories. Participants were informed that the parks they saw were under threat of closure, a situation which could be averted by either: 1) sufficient donations or 2) selling off 25% of the park to a third-party buyer, who would put the land to a specified use (from mining to sustainable agriculture to rock-climbing camps).
At the study's conclusion, one trial was randomly selected to count for real; any donation was deducted from the subject's starting endowment and given to their choice of the California State Parks Foundation or National Parks. Subjects were instructed that since only one trial's results would be enforced, they should treat each decision as wholly independent of the others, and not attempt to strategically parcel out their endowment between multiple trials.

Questionnaire
Participants filled out a detailed questionnaire to obtain basic demographics, affect ratings for each place and use, familiarity with the locales, perceived destructiveness and public benefits of the uses, and whether they had visited each park before. In the fMRI population, these subjective ratings were used as regressors to model brain activation. Dunlap's revised NEP scale8 was also administered to evaluate pro-environmental attitudes. Participants were asked about their level of environmental concern and involvement in pro-environmental causes, how often they visited state and/or national parks annually, and how much they donated annually to environmental charities.
Participants
Twenty-nine healthy right-handed English-speaking adults participated in the study. Participants had no history of neurological or psychiatric disorders, and were not taking medication to interfere with fMRI. Seven subjects were excluded for excessive head motion and/or not following instructions.
MRI Acquisition and Analysis
Images were acquired with a 3.0 T General Electric MRI scanner using a thirty-two channel head coil. Forty-six 2.9 mm thick slices (in-plane resolution 2.9 mm isotropic, no gap, interleaved acquisition) extended axially from the mid-pons to the crown of the skull, providing whole-brain coverage and good spatial resolution of sub-cortical regions of interest (e.g., midbrain, NAcc). Whole-brain functional scans were acquired with a T2*-weighted gradient echo pulse sequence (TR = 2 s, TE = 24 ms, flip = 77º). High-resolution structural scans were acquired with a T1-weighted pulse sequence (TR = 7.2 ms, TE = 2.8 ms, flip = 12º) after functional scans, to facilitate their localization and co-registration.
Whole brain analyses were conducted using Analysis of Functional Neural Images (AFNI) software (9). For preprocessing, voxel time series were sync interpolated to correct for non-simultaneous slice acquisition within each volume, concatenated across runs, corrected for motion, slightly spatially smoothed to minimize effects of anatomical variability (FWHM = 4 mm), high-pass filtered (admitting frequencies with period <90 s), and normalized to percent signal change with respect to voxel means for the entire task. Visual inspection of motion correction estimates confirmed that no subject’s head moved more than 2.0 mm in any dimension from one volume acquisition to the next.
For whole brain analyses, regression models included eight regressors of no interest, six of which indexed residual motion, and two of which indexed cerebrospinal fluid intensity and white matter intensity (10). Regressors of interest orthogonally contrasted iconic parks versus noniconic parks, conservative versus destructive uses, low versus high requested donation amounts. Additionally, interactions were modeled at the time when all relevant information was first present (e.g., iconicness x destructiveness was modeled during presentation of the proposed land use, while destructiveness x amount was modeled during presentation of the donation amount). Prior to inclusion in the model, regressors of interest were convolved with a single gamma-variate function that modeled a canonical hemodynamic response (11). Maps of t-statistics for regressors of interest were transformed into Z-scores, coregistered with structural maps, spatially normalized by warping to Talairach space, and resampled as 2mm cubic voxels.
Results
Issues of Interest: Differing Population Maps at N=18 and N=22
To examine generalizability of response as well as individual subjectivity, we created regressions based on the survey population's ratings (henceforth, "population" maps) and based on the subject's individual ratings.
In the process of analysis, we ran across something interesting (and mildly unsettling): we found relatively consistent results in the population maps for the first 18 subjects, which included ventral striatal activation for iconicness (Figure 2), bilateral insula activation for destructiveness of the land use (Figures 3 & 4), and interaction between the iconic x destructiveness in the MPFC (Figure 5).
- Population Maps at N=18
-
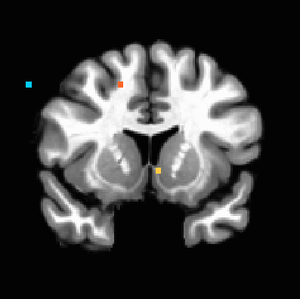 Figure 2. P<0.001 uncorrected, showing evidence of ventral striatal activation with increasing iconicness of the landscape.
 -
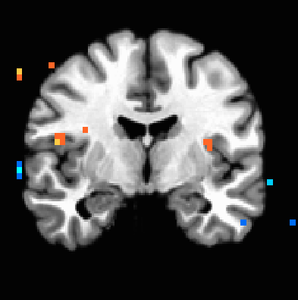 Figure 3. P<0.005 uncorrected, showing increased bilateral anterior insula activation with increasingly destructive land uses.
 -
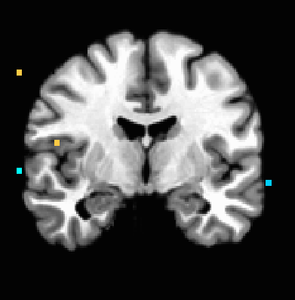 Figure 4. P<0.001 uncorrected; anterior insula activation holds on right side.
 -
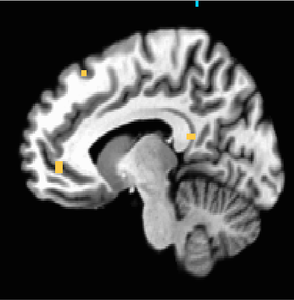 Figure 5. P<0.001 uncorrected; iconic x destructive interaction increases activation in the MPFC.


When four additional subjects were added to give us our final study population of 22, maps changed substantially. NAcc activation in response to iconicness became insignificant (Figure 6 shows it only holds until about p=0.006). Insula activation held on the left side (Figure 7). Iconic x Destructive interaction migrated higher up the MPFC to regions more dorsal than we would anticipate (Figure 9); we see the initial MPFC activation is still weakly evident at p=0.01 but does not survive at higher thresholds (Figure 8).
- Population Maps at N=22
-
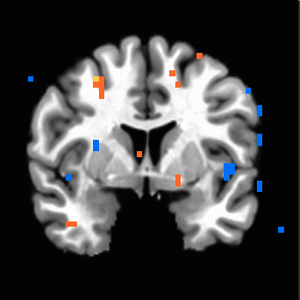 Figure 6. P<0.01 uncorrected, weak NAcc activation in response to iconicness which does not survive higher thresholds.
 -
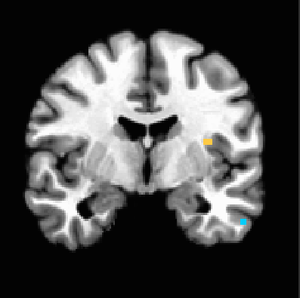 Figure 7. P<0.001 uncorrected, anterior insula activation remains strong on the left side in response to increasingly destructive land uses.
 -
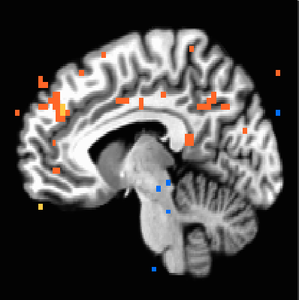 Figure 8. P<0.01 uncorrected, weak response to interaction of iconicness x destructiveness of original MPFC region of activation which does not survive higher thresholds.
 -
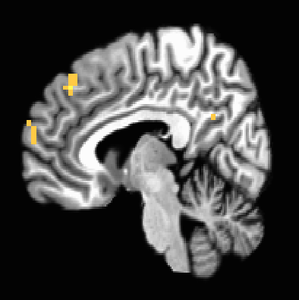 Figure 9. P<0.001 uncorrected, MPFC activations remain strong in more dorsal regions not as frequently associated with affect integration in valuation.


Before we attempt to learn exactly why the addition of four people may have caused loss of NAcc, we can look at the relevant subjective maps: that is, maps which base the stimulus ratings on those given by the subjects themselves. In these, we see much more solid NAcc activation in the same region as the population maps for n=22 (Figure 10), indicating that the loss of NAcc from the 4 additional subjects could be a stronger disconnect between the iconic ratings in the general population and their subjective ratings, than in the prior 18 subjects. Therefore, their perception of iconicness and response to the landscapes is more idiosyncratic.

The Final Four
An attempt to understand the idiosyncracies of the final 4 subjects began with motion graphs, using a Python script by Kiefer Katovich. This flags any single jump between 0.5 and 1 mm in any axis with a warning (in orange) and anything above 1 mm as dangerous (in red). Often subjects are


- Motion Graphs for Final 4 Subjects
-
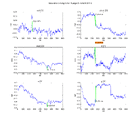 Figure 11. Subject BH.
 -
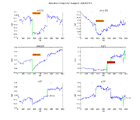 Figure 12. Subject DD.
 -
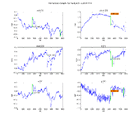 Figure 13. Subject KU.
 -
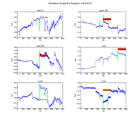 Figure 14. Subject ML.
Measuring retinotopic maps
Retinotopic maps were obtained in 5 subjects using Population Receptive Field mapping methods Dumoulin and Wandell (2008). These data were collected for another research project in the Wandell lab. We re-analyzed the data for this project, as described below.
Subjects
Subjects were 5 healthy volunteers.
MR acquisition
Data were obtained on a GE scanner. Et cetera.
MR Analysis
The MR data was analyzed using mrVista software tools.
Pre-processing
All data were slice-time corrected, motion corrected, and repeated scans were averaged together to create a single average scan for each subject. Et cetera.
PRF model fits
PRF models were fit with a 2-gaussian model.
MNI space
After a pRF model was solved for each subject, the model was trasnformed into MNI template space. This was done by first aligning the high resolution t1-weighted anatomical scan from each subject to an MNI template. Since the pRF model was coregistered to the t1-anatomical scan, the same alignment matrix could then be applied to the pRF model.
Once each pRF model was aligned to MNI space, 4 model parameters - x, y, sigma, and r^2 - were averaged across each of the 6 subjects in each voxel.
Et cetera.
Results - What you found
Retinotopic models in native space
Some text. Some analysis. Some figures.
Retinotopic models in individual subjects transformed into MNI space
Some text. Some analysis. Some figures.
Retinotopic models in group-averaged data on the MNI template brain
Some text. Some analysis. Some figures. Maybe some equations.
Equations
If you want to use equations, you can use the same formats that are use on wikipedia.
See wikimedia help on formulas for help.
This example of equation use is copied and pasted from wikipedia's article on the DFT.
The sequence of N complex numbers x0, ..., xN−1 is transformed into the sequence of N complex numbers X0, ..., XN−1 by the DFT according to the formula:
where i is the imaginary unit and is a primitive N'th root of unity. (This expression can also be written in terms of a DFT matrix; when scaled appropriately it becomes a unitary matrix and the Xk can thus be viewed as coefficients of x in an orthonormal basis.)
The transform is sometimes denoted by the symbol , as in or or .
The inverse discrete Fourier transform (IDFT) is given by
Retinotopic models in group-averaged data projected back into native space
Some text. Some analysis. Some figures.
Conclusions
Here is where you say what your results mean.
References - Resources and related work
References
Software
Appendix I - Code and Data
Code
Data
Appendix II - Work partition (if a group project)
Brian and Bob gave the lectures. Jon mucked around on the wiki.