KonradMolner: Difference between revisions
imported>Student2016 |
imported>Student2016 |
||
| Line 59: | Line 59: | ||
The displacement calculations are illustrated in the following graphics: | The displacement calculations are illustrated in the following graphics: | ||
[[File:EyeDistances.png|200px|thumb| | [[File:EyeDistances.png|200px|thumb|left]] | ||
== Conclusions == | == Conclusions == | ||
Revision as of 06:43, 19 December 2016
Introduction
Motivate the problem. Describe what has been done in the past.
Background
What is known from the literature.
Methods
Describe techniques you used to measure and analyze. Describe the instruments, and experimental procedures in enough detail so that someone could repeat your analysis. What software did you use? What was the idea of the algorithms and data analysis?
Results
In the following image we present the input stimuli presented to the eye from 0º to 1º rotations in 0.2º increments, from left to right. The top stimuli is 4m from the camera and the bottom stimuli is 25cm from the camera. Note the increasing horizontal disparity between the two stimuli as the eye rotation increases.

After passing these stimuli through our model for the eye, we observe the following series of images.

The following shows the observed cone absorbances on the fovea.

We locate the horizontal centroid of the line stimuli, in units of cones, with the following black and white image.

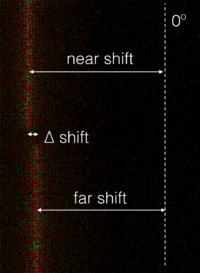
In the table below, we calculate the horizontal displacement from the 0º stimuli in units of cones, as well as the change in disparity between the near and far stimuli.
| Horizontal Eye Rotation | 0.2º | 0.4º | 0.6º | 0.8º | 1º |
|---|---|---|---|---|---|
| Near stimulus shift from 0º | 24.22 Cones | 49.40 Cones | 73.45 Cones | 97.46 Cones | 122.62 Cones |
| Far stimulus shift from 0º | 23.08 Cones | 46.40 Cones | 69.45 Cones | 92.50 Cones | 115.67 Cones |
| ∆ shift from near to far stimuli | 1.14 Cones | 3.01 Cones | 4.00 Cones | 4.69 Cones | 6.95 Cones |
The displacement calculations are illustrated in the following graphics:

Conclusions
Describe what you learned. What worked? What didn't? Why? What should someone next year try? References - List references. Include links to papers that are online.
Appendix I
Upload source code, test images, etc, and give a description of each link. In some cases, your acquired data may be too large to store practically. In this case, use your judgement (or consult one of us) and only link the most relevant data. Be sure to describe the purpose of your code and to edit the code for clarity. The purpose of placing the code online is to allow others to verify your methods and to learn from your ideas.
Appendix II
(for groups only) - Work breakdown. Explain how the project work was divided among group members.