Samir: Difference between revisions
imported>Psych204B mNo edit summary |
imported>Psych204B mNo edit summary |
||
| Line 39: | Line 39: | ||
===Data=== | ===Data=== | ||
<br> | <br> | ||
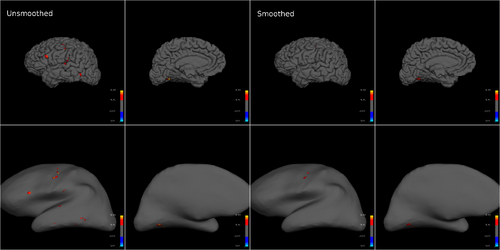
[[File:Fig2.png |thumb|600px| Figure 2 : T-statistic activation maps for subject 1 overlaid on their own anatomical data, for unsmoothed functional (A) and smoothed (3mm isotropic FWHM kernel) functional (B) data. T-values between 3-8 were rendered with a heat map. P<0.001 unc gives voxels at t>3. All shown regions also activated at P<0.05 FWE, t>4.5 in the unsmoothed data. Both functional and anatomical data were coregistered to the mean functional.]] | [[File:Fig2.png |thumb|600px| left| Figure 2 : T-statistic activation maps for subject 1 overlaid on their own anatomical data, for unsmoothed functional (A) and smoothed (3mm isotropic FWHM kernel) functional (B) data. T-values between 3-8 were rendered with a heat map. P<0.001 unc gives voxels at t>3. All shown regions also activated at P<0.05 FWE, t>4.5 in the unsmoothed data. Both functional and anatomical data were coregistered to the mean functional.]] | ||
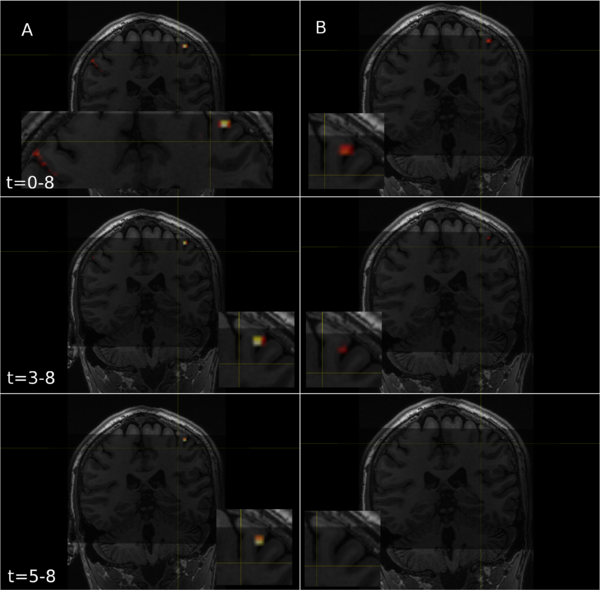
[[File:Fig3.png | thumb | 600px | Figure 3 : T-statistic activation maps for subject 1 at varying thresholds. The maps were thresholded with t varying from 0-4 at integer increments. P<0.05 FWE gives voxels at t>4.5.]] | [[File:Fig3.png | thumb | 600px | right | Figure 3 : T-statistic activation maps for subject 1 at varying thresholds. The maps were thresholded with t varying from 0-4 at integer increments. P<0.05 FWE gives voxels at t>4.5.]] | ||
<br> | <br> | ||
For the high-resolution data we collected, smoothing substantially decreased the T-statistic across the dataset, and often led to a complete loss of significantly activated voxels in entire brain regions (Fig. 2). While smoothing theoretically increases signal to noise, the effect did not help our analysis. | For the high-resolution data we collected, smoothing substantially decreased the T-statistic across the dataset, and often led to a complete loss of significantly activated voxels in entire brain regions (Fig. 2). While smoothing theoretically increases signal to noise, the effect did not help our analysis. | ||
Revision as of 10:04, 13 March 2012
Probing BOLD Responses For Motor Tasks With High-Resolution fMRI
Summary
This project explores how high resolution fMRI can be used to probe activity in the brain's motor regions, the motor cortex, the basal ganglia and the cerebellum. A first step towards designing experiments that can probe their motor representation is to validate different protocol and processing algorithm choices made while processing data to get statistical significance maps. Here, I investigated:
1. How data smoothing might influence the interpretation of high resolution motor fMRI data
2. How motor activity varies across subjects
3. How motor activity varies across time
4. How to quantify the information content in time series data for significantly activated voxels
Motivation
The ability to coordinate muscles and resolve inter-task conflicts is fundamental to human motor control, and underlies even simple motions like holding a cup with a hand and flipping a switch with the same arm’s elbow. The arm muscles that help hold the cup, one task, must also flip the switch, another task, creating a conflict that the brain must resolve while coordinating the muscles. Past research has not elucidated the brain’s coordination strategy largely because it has focused on tasks in isolation [cite]. Moreover such experiments are confounded by the fact that at a fine spatial scale, motor related neurons correlate with all observable movement parameters [cite] , while at a higher spatial scale, fMRI experiments have been unable to delineate any generalizable motor organization apart from fractured somatotopic sensorimotor maps [cite].
Probing the motor control regions in a manner that elucidates the structure of the underlying motor controller thus requires novel experiments, whose results might be hard to interpret under existing statistical analysis pipelines. Here, I will highlight how the same data might be interpreted in multiple ways with minor changes to the processing pipeline.
Methods
A novel motor control dataset was acquired for this study. It is detailed below.

Subject Details
As part of our study, we scanned XXX healthy right-handed volunteers (XXX males; 19–28 yr of age). All subjects were informed about the experiment's details in advance, and gave their informed written consent to a protocol approved by the Institutional Review Board of Stanford University. The subjects were healthy and did not have any psychiatric or neurological disorders at the time or in the past. Subjects were asked to lie supine on the scanner bed, and their heads were surrounded by cloth to comfort and reduce head movements. In addition, they bit down on a bite bar for the duration of the study. The bite bar was customized to each subject's dental structure with a slow-hardening putty.
Task Details
Subjects were asked to perform writing tasks like drawing a square while holding a pencil at three linearly spaced grasp locations They were provided visual text stimuli indicating when to plan and execute motions, and when to rest. For instance, one stimulus sequence would be: `Plan : Square : Tip' (yellow, 5 sec), `Execute : Square : Tip' (green, 8 sec), and `Rest' (red, 3-11 sec, randomized). During the plan phase subjects would plan their motion and possibly adjust grasp position, but would not make any whole arm motions. During the execute phase, subjects would move their entire arm to draw a square, without any finger movement. And during the rest phase, they would place their arm on their torso and rest. Subjects were asked to abandon tasks midway if they could not complete them in time.
The task presentation was randomized and orthogonalized using optseq (http://surfer.nmr.mgh.harvard.edu/optseq/). A sample design matrix representing one subject's task presentation demonstrates optseq's sequencing (Fig. 1).
Stimulus Presentation
The task description text was displayed on a modified Samsung SyncMaster 305T 30 inch diagonal display (76 cm, 16:10 aspect ratio), built by Resonance Technology (www.mrivideo.com) at a resolution of 1280x800 pixels. Subjects viewed the display through a double mirror at a distance of about 190cm from the head-coil, and the display was inverted so text appeared normal to the subjects. The text was rendered on the screen using VisionEgg, a freely available python based stimulus presentation software.
Scan Sequence Details
We acquired images GE MR 750 3-Tesla scanner and a Nova 32 channel head coil at the Stanford Center for Cognitive and Neurobiological Imaging (CNI). Two series of 510 functional volumes were acquired using a gradient echo, echoplanar sequence with a 134 square matrix, 27 oblique slices, 2mm thick, with a 0.5mm gap between slices. The voxel size was 1.5mm x 1.5mm x 2.0mm, repetition time was 2 sec, echo time was 33ms and flip angle was 75degrees. The slices were adjusted for each subject to include cerebellum, posterior striatum, and motor cortex.
The functional images were overlaid on a co-aligned, high-resolution anatomical scan of the whole brain taken at the end of each session (BRAVO sequence; TR = 7.8 sec; TE = 3.1 ms, flip angle = 12 degrees; matrix, 300x300; 0.8 mm, isotropic).
How smoothing influenced our dataset
Data


For the high-resolution data we collected, smoothing substantially decreased the T-statistic across the dataset, and often led to a complete loss of significantly activated voxels in entire brain regions (Fig. 2). While smoothing theoretically increases signal to noise, the effect did not help our analysis.
The only metric where smoothing held an advantage, was that it avoided false positives throughout the data (Fig. 3).
An important aspect to note is that while anatomical and smoothed functional underlays might display grey matter, CSF related scanner artifacts could have actually created voids at the same position. However, if activation in the void persists after carefully checking the data for motion artifacts and using family-wide error correction you can't reject it. The vasculature is often dense at the boundaries of the cortical surface and if the neural activation in neighboring regions is strongly correlated with the task, then the blood flow in the vasculature might make it seem like the BOLD signal is coming from the artifact region [Personal communications with Prof. Gary Glover, Stanford University].
How does motor activity vary across subjects?
Data

To avoid co-registration and normalization related errors altogether, I reconstructed individual subject's brain surfaces, created by processing the anatomical scan with freesurfer. Interestingly, <write a bit about the results>.
How does motor activity vary across time?
Data
 <Replicates Kawato's result in cerebellum>
How do the individual voxel time series correlate with tasks?
Data
Figure 6 : Time series data for significantly activated voxels during motion for subjects 1-3. <Add a description of the data and some analysis>
Discussion and Future Work
Appendix
Presentation
Script
REFERENCES
[1]