HaomiaoJiang: Difference between revisions
imported>Projects221 |
imported>Projects221 No edit summary |
||
| Line 8: | Line 8: | ||
= Background = | = Background = | ||
== Display Characterization == | == Display Characterization == | ||
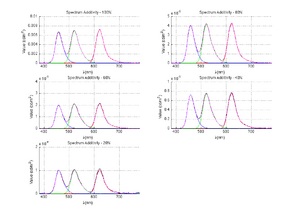
[[ | [[Image:SonyBVMSpectrumAdditivity.png |thumb|right|500pix| Figure 1 SPD Shape under Different Brightness Levels]] | ||
Display characterization is the process to build proper models for certain displays and estimate the underlying parameters. The display characteristics are usually measured in two categories, spatial properties and temporal properties. Spatial properties mainly include display gamma value, color bit depth, spectral power distribution, color spectral additivity, pixel independence and so on. Temporal properties include refresh rate, color breakup and so on. Among them, color bit-depth, refresh rate are given by the manufacture and these parameters will not vary a lot between displays. Also, shape of spectral power density is similar among LCD displays, which is shown in figure 1 on the right. | |||
However, gamma values are different from display to display, even if they are from the same manufacture. So measuring or estimating the gamma for each display is essential in calibrating the display model. | However, gamma values are different from display to display, even if they are from the same manufacture. So measuring or estimating the gamma for each display is essential in calibrating the display model. | ||
Revision as of 23:35, 19 March 2013
Back to Psych 221 Projects 2013
Background
Display Characterization

Display characterization is the process to build proper models for certain displays and estimate the underlying parameters. The display characteristics are usually measured in two categories, spatial properties and temporal properties. Spatial properties mainly include display gamma value, color bit depth, spectral power distribution, color spectral additivity, pixel independence and so on. Temporal properties include refresh rate, color breakup and so on. Among them, color bit-depth, refresh rate are given by the manufacture and these parameters will not vary a lot between displays. Also, shape of spectral power density is similar among LCD displays, which is shown in figure 1 on the right.
However, gamma values are different from display to display, even if they are from the same manufacture. So measuring or estimating the gamma for each display is essential in calibrating the display model.
Gamma Curve
Gamma curve characterize the relationship between the inputs value and the output luminance levels. Actually, this encodes and decodes luminance or tristimulus values in video or still image systems.
Gamma is also sometimes called gamma correction, gamma nonlinearity or gamma encoding. Mathematically, gamma correction is, in the simplest cases, defined by the power-law expression:
Since black is not purely black and there always more or less exists ambient lighting, we can add a constant term as
Usage in Vision Experiment
MNI is an abbreviation for Montreal Neurological Institute.
Measuring Methods
Traditional Measuring Methods
Retinotopic maps were obtained in 5 subjects using Population Receptive Field mapping methods Dumoulin and Wandell (2008). These data were collected for another research project in the Wandell lab. We re-analyzed the data for this project, as described below.
Dithering Methods
Subjects were 5 healthy volunteers.
Online Dithering Test
Data were obtained on a GE scanner. Et cetera.
Test Results
Subjects and Test Environment
Some text. Some analysis. Some figures.
Dithering Method Test Results
Some text. Some analysis. Some figures.
Online Dithering Test Results
Some text. Some analysis. Some figures. Maybe some equations.
Analysis and Comments
Limitations
Influential Factors
Conclusions
Here is where you say what your results mean.
References
Software

