Matthew Potter: Difference between revisions
imported>Psych204B |
imported>Psych204B |
||
| Line 45: | Line 45: | ||
[[File:mt.jpg|frame|right|Figure 1: MT ROIs, Beta Responses, and Cross-correlation Matrices]] | [[File:mt.jpg|frame|right|Figure 1: MT ROIs, Beta Responses, and Cross-correlation Matrices]] | ||
In the MT, which is used as a control, since it is presumably not selective for the stimuli in the experiment, the beta response in the left hemisphere show slight selectivity for objects, with confusability between faces and places. In the right hemisphere beta responses, selectivity for children's faces is indicated, with confusability between men's faces, indoor scenes, and objects. | |||
<br> | <br> | ||
<br> | <br> | ||
The cross-correlation matrix for the left hemisphere | The cross-correlation matrix for the left hemisphere shows effective discrimination for all categories, in a significant departure from the corresponding beta values. Similarly, the right hemisphere cross-correlation matrix shows effective discrimination between all categories save for outdoor scenes and abstract objects. | ||
<br> | <br> | ||
<br> | <br> | ||
Revision as of 05:47, 20 March 2010
Back to Psych 204B Projects 2010
Timecourses vs. Multi-Voxel Patterns in Face- and Place-selective Regions
This project investigates the selectivity of the Fusiform Face Area (FFA), Occipital Face Area (OFA), Parahippocampal Place Area (PPA), and Temporo-Occipital Sulcus (ToS) in terms of timecourses and multi-voxel patterns, using the human motion area (MT), which is presumably not selective for these objects, as a control.
Background
Though certain regions of the brain show a preference for certain objects, e.g. faces or places, whether these regions are specialized for this task, or whether the task is distributed across a wider region of the brain, is a subject of debate. One facet of this debate is the use of regions of interest (ROIs), across which the mean beta response is generally calculated. Is this assumption reasonable, or is important information lost by not analyzing the distribution of activity across the individual voxels? Do the two methods lead to the same interpretation of the function of certain regions?
Methods
Subjects
One 22-year-old female participated in this study.
MR acquisition
Images for this study were acquired on a 3T GE Signa MRI scanner at Stanford University.
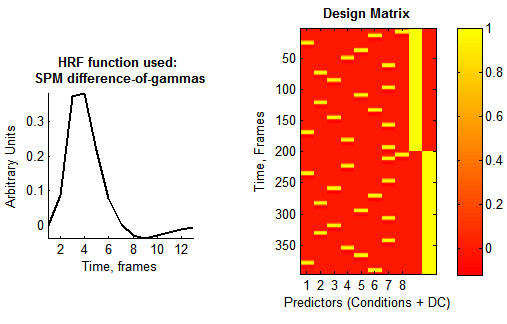
To define face-, place-, and motion-selective regions of interest, three localizer experiments were performed. For the face- and place-selective localizer, a GLM with two regressors, alternating blocks of faces and places presented to the fovea, was estimated. For the motion-selective localizer, a GLM with two regressors, alternating blocks of expanding and contracting low-contrast gratings, was estimated. Next, regressors were convolved with the SPM hemodynamic response function. Lastly, an independent run consisting of alternating blocks of faces, places, and objects was used to investigate the brain activation in associated with these items in the regions of interest defined by the localizers.
MR Analysis
For each region of interest, the timecourse and multi-voxel pattern responses were computed using mrVista.
Results
Legend
For the figures in this section, the following abbreviations are used:
CH: Child's Face
M: Adult Male's Face
I: Indoor Scene
O: Outdoor Scene
CA: Car
A: Abstract Object
Data Interpretation
When looking at the beta responses, selectivity is indicated by a high ratio between the magnitude of the preferred category and the magnitude of the non-preferred categories. Confusability is indicated by a low ratio between these two magnitudes. For the cross-correlation matrices, selectivity is indicated by "hot" on-diagonal elements and "cold" off-diagonal elements. A "hot" off-diagonal element indicates confusability. This method of interpretation applies to all data in the results section.
ROIs, Beta Responses, and Cross-correlation Matrices
Human Motion Area (MT): Control Region
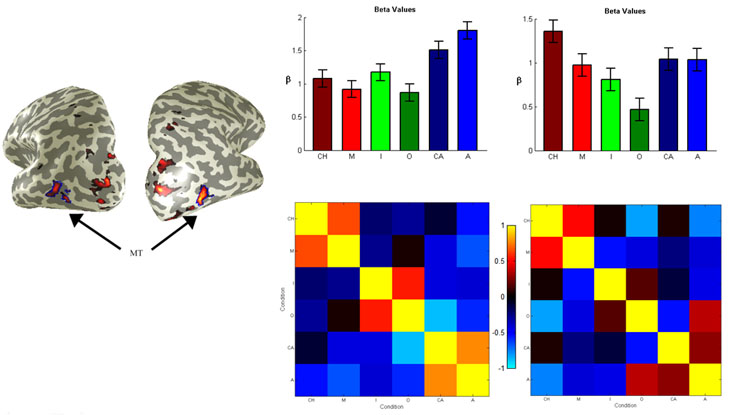
In the MT, which is used as a control, since it is presumably not selective for the stimuli in the experiment, the beta response in the left hemisphere show slight selectivity for objects, with confusability between faces and places. In the right hemisphere beta responses, selectivity for children's faces is indicated, with confusability between men's faces, indoor scenes, and objects.
The cross-correlation matrix for the left hemisphere shows effective discrimination for all categories, in a significant departure from the corresponding beta values. Similarly, the right hemisphere cross-correlation matrix shows effective discrimination between all categories save for outdoor scenes and abstract objects.
Fusiform Face Area (FFA)
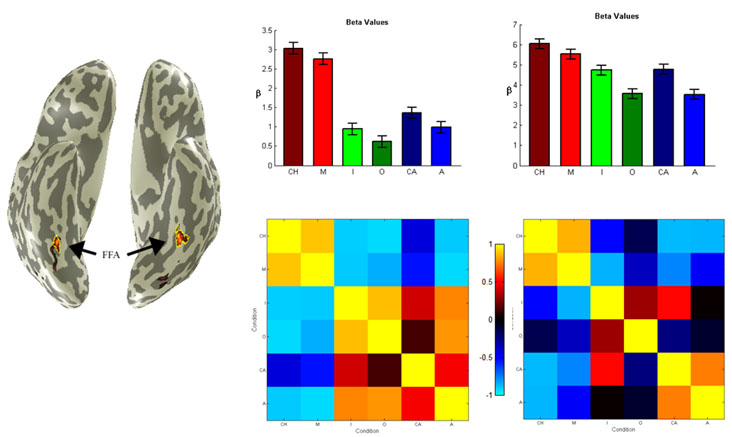
For the FFA, the beta responses in the left hemisphere show excellent selectivity for faces, with possible confusability between places and objects. In the right hemisphere, there is little variation between the magnitudes of the beta responses, indicating confusability between faces, places, and objects. However, the region is still slightly selective for faces.
The cross-correlation matrix for the left hemisphere confirms the information in the corresponding beta responses: excellent discrimination1 of faces and high-confusability between places and objects. The cross-correlation matrix for the right hemisphere departs from the corresponding beta responses, showing decent discrimination of faces and somewhat less confusability between places and objects.
Occipital Face Area (OFA)
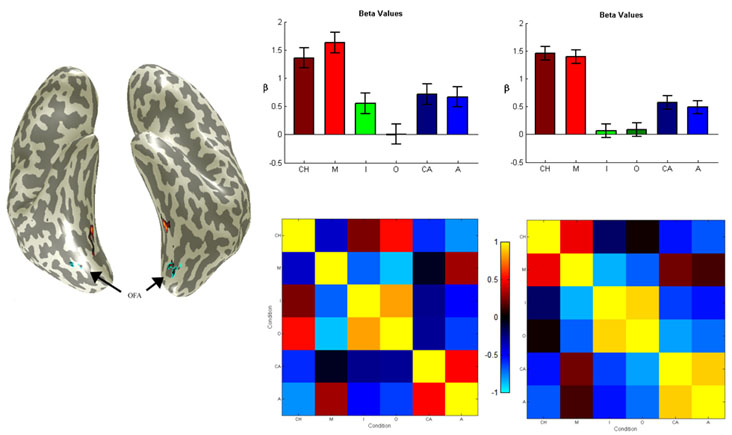
For the OFA, beta responses in the left hemisphere show high selectivity for faces, with possible confusability between indoor scenes and objects. In the right hemisphere, the beta values again show high selectivity for faces, but lessened confusability between places and objects.
The cross-correlation matrix for the left hemisphere, in a departure from the beta values, shows confusability between children's faces and places and men's faces and objects. In the right hemisphere, the cross-correlation shows some confusability between men's faces and objects. This is a significant departure from the beta responses.
Parahippocampal Place Area (PPA)
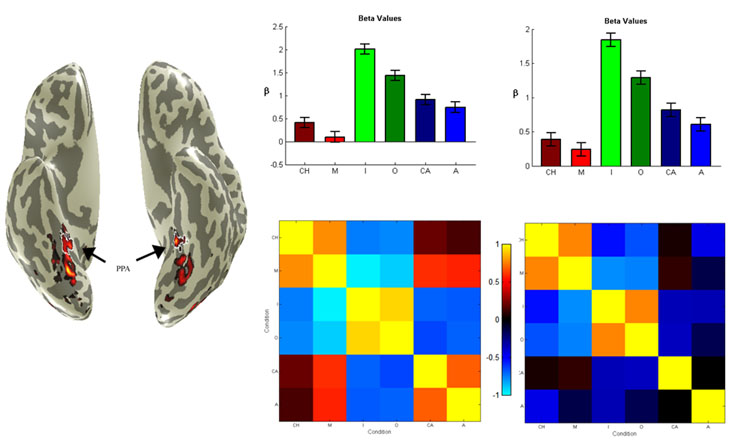
For the PPA, beta responses in the left hemisphere show selectivity for places, with possible confusability with objects -- particularly between outdoor scenes and cars. In the right hemisphere, the beta values show a somewhat stronger preference for places, and lessened confusability with objects.
The cross-correlation matrix for the left hemisphere, in a departure from the beta values, shows confusability between faces and objects, and very little confusability between places and objects. In the right hemisphere, the cross-correlation shows very little confusability between any of the categories.
Temporo-Occipital Sulcus (TOS) Place Area
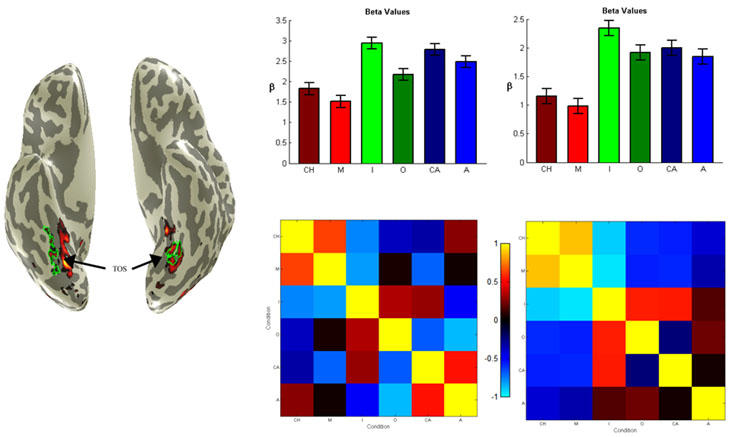
Unfortunately, the ROI for the TOS was defined erroneously. This error is reflected in the results. In the left hemisphere there is confusability between most of the categories. In the right hemisphere, the data supports the notion that this region is capable of discriminating faces through lower relative activation.
Conclusions
Here is where you say what your results mean.