KonradMolner
Introduction
Motivate the problem. Describe what has been done in the past.
Background
Near-eye Displays with Focus Cues
Generally, existing focus-supporting displays can be divided into several classes: adaptive focus, volumetric, light field, and holographic displays.
Two-dimensional adaptive focus displays do not produce correct focus cues -- the virtual image of a single display plane is presented to each eye, just as in conventional near-eye displays. However, the system is capable of dynamically adjusting the distance of the observed image, either by physically actuating the screen [Sugihara and Miyasato 1998] or using focus-tunable optics [Konrad et al. 2016]. Because this technology only enables the distance of the entire virtual image to be adjusted at once, the issue with these displays is that the correct focal distance at which to place the display depends on point in the simulated 3D scene the user is looking at.
Three-dimensional volumetric and multi-plane displays represent the most common approach to focus-supporting near-eye displays. Instead of using 2D display primitives at some fixed distance to the eye, volumetric displays either mechanically or optically scan out the 3D space of possible light emitting display primitives in front of each eye [Schowengerdt and Seibel 2006]. Multi-plane displays approximate this volume using a few virtual planes [Dolgoff 1997; Akeley et al. 2004; Rolland et al. 2000; Llull et al. 2015].
Four-Dimensional light field and holographic displays aim to synthesize the full 4D light field in front of each eye. Conceptually, this approach allows for parallax over the entire eyebox to be accurately reproduced, including monocular occlusions, specular highlights, and other effects that cannot be reproduced by volumetric displays. However, current-generation light field displays provide limited resolution [Lanman and Luebke 2013; Hua and Javidi 2014; Huang et al. 2015] whereas holographic displays suffer from speckle and have extreme requirements on pixel sizes that are not afforded by near-eye displays today. Our proposed display mode falls into this light field producing category.
Microsaccades
Microsaccades are a specific type of fixational eye movement, characterized by high angular velocity, large angular rotation motion after a period smaller, less directed random eye motion. Microsaccades exhibit a preference for horizontal and vertical movement and occur simultaneously, suggesting a common source of generation [Zuber et al]. They are generally binocular in behavior and the velocity of the saccade is directly proportional to the distance the eye has wandered during fixation .
While microsaccades have been documented across a wide range of research studies, there is no formal definitions or measurement thresholds for microsaccades. Definitions of microsaccades change depending on what best fits context of the study [Martinez-Conde]. Across literature, angular velocities vary between 8º/sec and 40º/sec. Frequencies vary between 0.5Hz and 2Hz and angular rotation ranges from 25’ to 1.5º.
Methods
Our project relies heavily on simulation to better understand the depth cues and parallax afforded during a microsaccade. The ISETBIO Toolbox for MATLAB proved to be incredibly useful for modeling the human eye optics and for quantifying the lateral disparity due to objects at different depths during a microsaccade. To simulate physically accurate rotations of the eye during eye drift we render images in OpenGL which we then use as the stimulus in ISETBIO.
OpenGL Pipeline
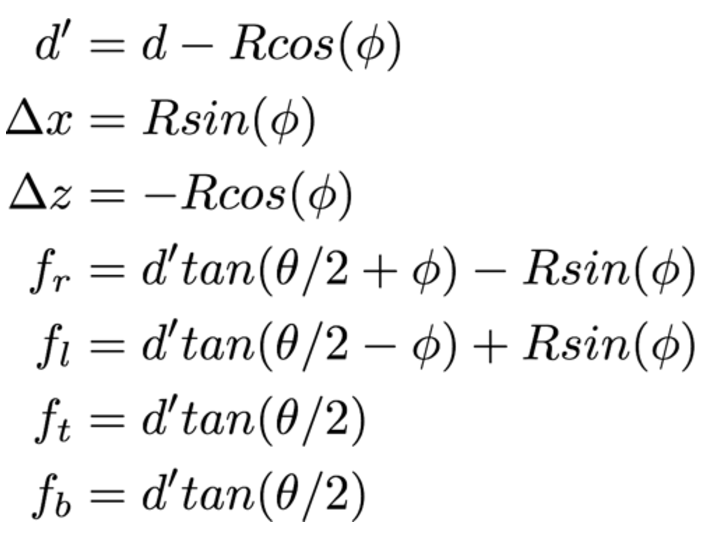
OpenGL is a cross-platform API for rendering 2D and 3D vector graphics. Using OpenGL we are able to render 3D scenes with parameters similar to that of the eye. We generate a rotational model of the eye that accurately represents what an eye might “see” during eye drift. Using OpenGL we render the viewpoint from the center of the pupil, making the strong assumption that the pupil is infinitely small (i.e. the pinhole model of the eye). Using OpenGL, we render two line stimuli at distances of 25 cm and 4m from the camera. The stimuli are scaled to have the same perceived size. To evaluate different amounts of drift we render the scene with varying amounts of eye rotations. We use 0.2º horizontal increments with a maximum rotation of 1º. For each rotation angle, we re-render the scene. We project the 3D scene onto a plane 1m , as indicated by d, away from the retina, with a 2º field of view as indicated by θ. We then use ISETBIO, as described in the next section, to see the amount of parallax generated on the retina itself.
To create an accurate representation of what the eye may see when it drifts by some angle Φ, we must consider that there is both a slight shift in the pupil location, indicated by Δx and Δz, and a change in the viewing direction. Assuming an eye radius R of 12mm, the change in pupil positions are indicated by equations 2 and 3. The perspective shift is accounted for in equations 4-7, and is in terms of the change in viewing frustum. All of these variations are accounted for in our rendering model.
ISETBIO Pipeline
Our model of the human eye was built with the human eye optics template in ISET BIO. We give the eye a horizontal field of view of 2º, enough to cover the fovea and for the eye to move by one degree on either side during a simulated microsaccade. Additionally, we focused our eye at a distance of 1m, a typical viewing distance for head mounted displays. Watson et al. show that a 4mm pupil is an appropriate diameter to use in simulations with current-day VR headsets. We also use a focal length of 17mm. Our model for the retina is the standard ISETBIO model, sized to cover the horizontal field of view of 2º.
In MATLAB, we feed each rotated image through our model of human eye optics. After this step, we see chromatic aberrations and blurring of our stimuli. The image achieved in this step represents the optical image projected onto the retina. We then project this image onto the retina and compute the cone absorbances across the fovea. Using traditional image processing techniques, we locate the horizontal centers of the line stimuli at each rotation. From these centers, we can calculate the lateral shift across the fovea in units of cones.
Results
In the following image we present the input stimuli presented to the eye from 0º to 1º rotations in 0.2º increments, from left to right. The top stimuli is 4m from the camera and the bottom stimuli is 25cm from the camera. Note the increasing horizontal disparity between the two stimuli as the eye rotation increases.

After passing these stimuli through our model for the eye, we observe the following series of images.

The following shows the observed cone absorbances on the fovea.

We locate the horizontal centroid of the line stimuli, in units of cones, with the following black and white image.

In the table below, we calculate the horizontal displacement from the 0º stimuli in units of cones, as well as the change in disparity between the near and far stimuli.
| Horizontal Eye Rotation | 0.2º | 0.4º | 0.6º | 0.8º | 1º |
|---|---|---|---|---|---|
| Near stimulus shift from 0º | 24.22 Cones | 49.40 Cones | 73.45 Cones | 97.46 Cones | 122.62 Cones |
| Far stimulus shift from 0º | 23.08 Cones | 46.40 Cones | 69.45 Cones | 92.50 Cones | 115.67 Cones |
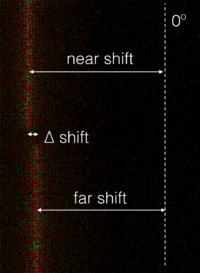
| ∆ shift from near to far stimuli | 1.14 Cones | 3.01 Cones | 4.00 Cones | 4.69 Cones | 6.95 Cones |
The displacement calculations are illustrated in the following graphics:

Conclusions
In Comparison to the pupil
Assuming an eye radius of 12mm and a 1º microsaccade, only 0.209mm of parallax are generated on the pupil. This 0.209mm of parallax corresponds to the 6.95 cone shift between the near and far stimuli in our simulation.
We hypothesize that the 4mm of parallax generated across the pupil, assuming a pinhole camera model at the limits of the pupil, serve as a much stronger depth cue than the parallax observed during a microsaccade. In future work, we look to simulate the parallax observed across the pupil opening alone, in units of cones, for better comparison with our microsaccade simulation.
Hacking the visual system
Our simulation of the retinal disparity due to a microsaccade looked to evaluate the amount of parallax one experiences when examining the natural, static world, with the same eye optics as when wearing a VR headset. While we certainly observed horizontal parallax and believe that this could serve as a depth cue for accommodation, the parallax across the pupil opening was much larger, indicating that it is a stronger depth cue than parallax during a microsaccade.
In contrast to the real world, VR displays allow us to project different images onto the eye at any point in time. If a rendering engine knew when the eye was microsaccading, successive video frames with greater horizontal disparity than normal could be shown, forcing stronger parallax across the retina, and therefore driving accommodation more aggressively than typically experienced. The strength to which this could serve as the accommodation could be adjusted, based on the content in the scene, and to the depth that would alleviate vergence-accommodation strains.
Future Work
Simulations of parallax across the retina due to microsaccades allowed us to draw our conclusion that depth information could be gathered during fixational eye movements. Before we can fully understand the strength of this depth cue, we first need to better understand the retinal shift, in cone disparity, due to parallax across the pupil. We can simulate this by placing two pinhole cameras 4mm apart from each other and running the same optical simulations and disparity measurements.
Moving from simulation to physical measurements, we need a high resolution, high speed eye tracker, as well as displays with high refresh rates, enabling us to display different images to the eye during fixational eye movements.
Furthermore, there is little research on how strongly accommodation is influenced by parallax across the retina. User studies that measure accommodation across a range of apertures will inform how much parallax we will need to overcome to drive accommodation with parallax between successive video frames.
Citations
- Watson, Andrew B., and John I. Yellott. "A unified formula for light-adapted pupil size." Journal of vision 12.10 (2012): 12-12.
- Martinez-Conde, Susana, et al. "Microsaccades: a neurophysiological analysis." Trends in neurosciences 32.9 (2009): 463-475.
- Wandell, Brian. ISETBIO. Computer software. Http://isetbio.org/. Computational Eye and Brain Project, n.d. Web.
- Wandell, Brian A. Foundations of vision. Sinauer Associates, 1995.
- Engbert, Ralf. "Computational modeling of collicular integration of perceptual responses and attention in microsaccades." The Journal of Neuroscience 32.23 (2012): 8035-8039.
- Rolfs, Martin. "Microsaccades: small steps on a long way." Vision research 49.20 (2009): 2415-2441.
- Engbert, Ralf, et al. "An integrated model of fixational eye movements and microsaccades." Proceedings of the National Academy of Sciences 108.39 (2011): E765-E770.
Appendix I
Upload source code, test images, etc, and give a description of each link. In some cases, your acquired data may be too large to store practically. In this case, use your judgement (or consult one of us) and only link the most relevant data. Be sure to describe the purpose of your code and to edit the code for clarity. The purpose of placing the code online is to allow others to verify your methods and to learn from your ideas.
Appendix II
Robert tackled the OpenGL portions of the simulation, while Keenan created the ISETBIO model and image processing pipeline to measure cone disparity. We collaborated on the presentation, future work, and write up.

