Kahane
Image Forensics Psych 221 Final Project - Matthew Kahane
Image Forensics
In a forensic analyst's ideal world, the images we see would be faithful representations of what was seen by the camera. There are situations in which we would like to detect whether an image has been JPEG compressed multiple times. A doubly JPEG compressed image would indicated that the image has been saved multiple times and is thus more likely to have been tampered with in between the first save (ostensibly by the camera) and the second save (perhaps in photoshop or some other editing software.) Based on the work of Dartmouth Professor Hany Farid (among others), this project implements code that simulates any level of compression. Thus, when a forensic analyst looks at the DCT coefficients from a JPEG file, he can compare these coefficients with any suspected multiple compression scheme.
I also attempted to implement a tester to look at a JPEG image but was foiled by the task of ripping DCT coefficients directly from JPEG.
Introduction
Let us begin with the ideas behind JPEG compression. JPEG (which stands for Joint Photographic Experts Group) has become an image compression standard. The algorithm behind standard JPEG compression is as follows:
- For each pixel channel(
    #Traverse the image in raster form and for each 8 x 8 blocks of pixels
         #Apply a 2D Discrete Cosine Transform (DCT) to each 8 x 8 block - This results in an 8 x 8 block of DCT coefficients
         #Divide this 8 x 8 block of DCT coefficients by an 8 x 8  quantization table
         #Take the floor of this quantized table
         #We now have an 8 x 8 representation of the uncompressed 8 x 8 pixel block but due to quantization and rounding, many of the coefficients are the same.
         #This new quantized block can be Huffman encoded, losslessly
We see that the key step of this compression process is the quantization and loss. When we simply have an 8 x 8 block of coefficients, we are still one-to-one with the original pixel table. However, dividing by an integer and rounding will cause information loss. We can also intuit that dividing by a larger number causes more coefficients to be rounded to zero. Because of this, the quantization table is often very small (close to one) in the upper left corner - the coefficient for low spatial cosines - and very large (on the order of 10 or so) in the lower right corner - the coefficient for large spatial cosines. This is because an image can stand to lose a lot of information in high spatial frequencies without losing too much discernable quality.
Background
How then, can we leverage this algorithm to distinguish doubly compressed images. Let us consider DCT coefficients (for instance the 1,1 frequency or 2,2 frequency) across all 8 x 8 transformed blocks of an image channel. We can put these coefficients into a histogram. If we begin with an uncompressed image, and simply take the unquantized DCT coefficients, these should be pretty randomly distributed - as random as the pixel values themselves. After quantization and rounding though, there will be a pattern based on how heavy the quantization is. For instance, heavy quantization will produce a lot of zeros. We are taking these coefficients and forcing them into bins. What happens, then, if we do this a second time? We will look first at an intuitive explanation and then at a rigorous explanation
Intuitive
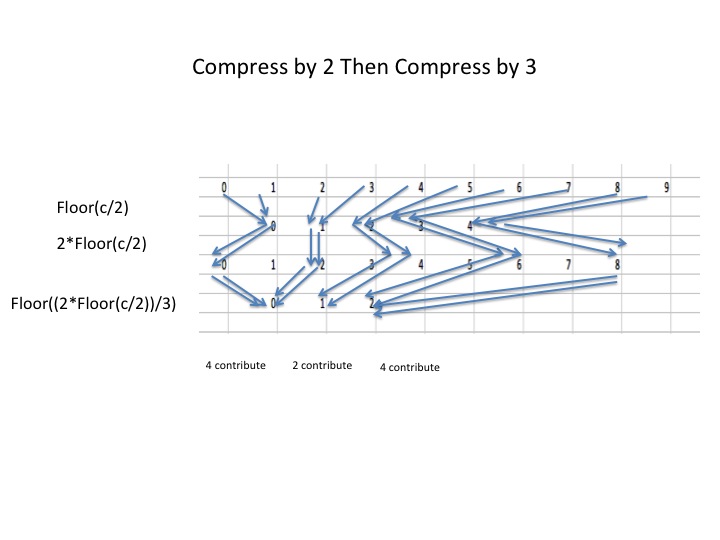
First let us consider an image with coefficients in 10 buckets (0-9). Let us trace these coefficients as they contribute to buckets after compression, decompression, and then recompression. The first example will be compression by 2 followed by compression by 3
Notice that the number of original buckets that contributes to these final buckets varies periodically. Meaning the number of elements in each of the final buckets will vary somewhat periodically.
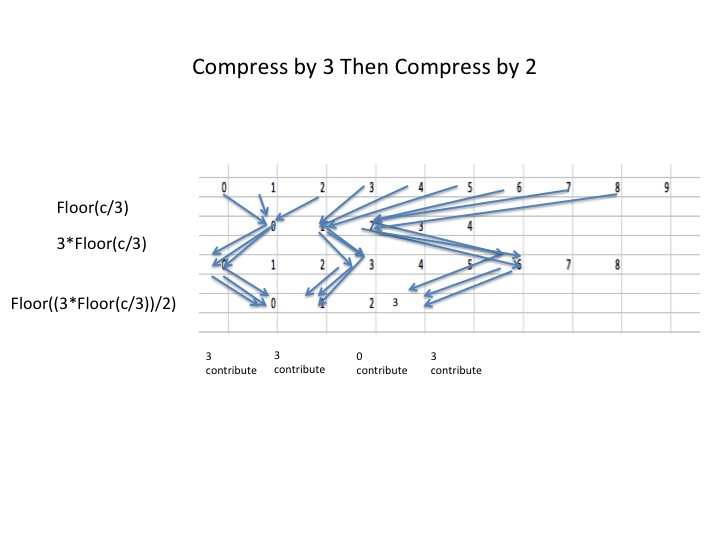
Next Let us consider the same original image but we will compress by 3 then by two
Notice that every so often, we will get buckets that have zero contributions from the original buckets. Again, we will see periodic artifacts in the histogram.
Rigorous Results
consider first a quantized signal
Double quantization by then gives a signal
Now we can imagine the histogram of coefficients for this double quantized signal. Let us call it
where
The idea that multiple compression produces high frequency artifacts in the coefficient histogram is nontrivial, but the proof itself is not terribly difficult to follow. Reference 1 draws it out in detail. The important result, though is this: If we define the number of original histogram bins, , this can be solved to get the following result:
If we take the intuitive example from above, where a = 3 and b = 2, we can see that for any integer
So every 3k+2 bins in the doubly compressed histogram will be empty. Applying a fourier transform to the histogram (represented as a discrete function) will result in high frequency artifacts from the varying numbers of original bins contributing to new bins.
Methods
This derivation for two compressions is somewhat accessible, but let us say we want to develop something that detects higher levels of compression, we need to know what we are looking for. This is why I developed something to simulate any number of compression levels. It allows us to almost instantly see empirical evidence for what the Fourier transforms of the compression would look like. This would be an invaluable tool in understanding what kind of compressions an image has undergone.
Simulating Compression
The first attached code in Appendix A simulates multiple compressions on an uncompressed image:
The general method is this:
- Load an uncompressed image
- Decide on the DCT component to inspect i.e. (1,1) through (8,8)
- Decide on compression levels to test
- For each compression level
    #Raster through the 8x8 blocks of the image, for each block
         #Apply DCT to block
         #Divide block by compression level
         #Take floor of quantized block
    #Make histogram/fourier plots of the desired quantized coefficients
    #Decompress in case you want to see image quality or "decompressed periodicities"
    #Decompressed becomes new image for compression
This allows us to look at the fourier components of histograms for the following interesting cases:
compression by a,b such that a>b
b>a
b/a = integer
a or b = 1
But these results can be reasoned analytically if you did well in EE 261 (which I did not)
The point of this program is to analyze the results of nontrivial compressions. For example, what would happen after triple compression by a,b,c such that
(a>b)<c (a=c)>b
These cannot be reasoned quite as easily. Therefore, if we want to detect them, we will have to know what they may look like.
Results
Results of Simulating Double Compression
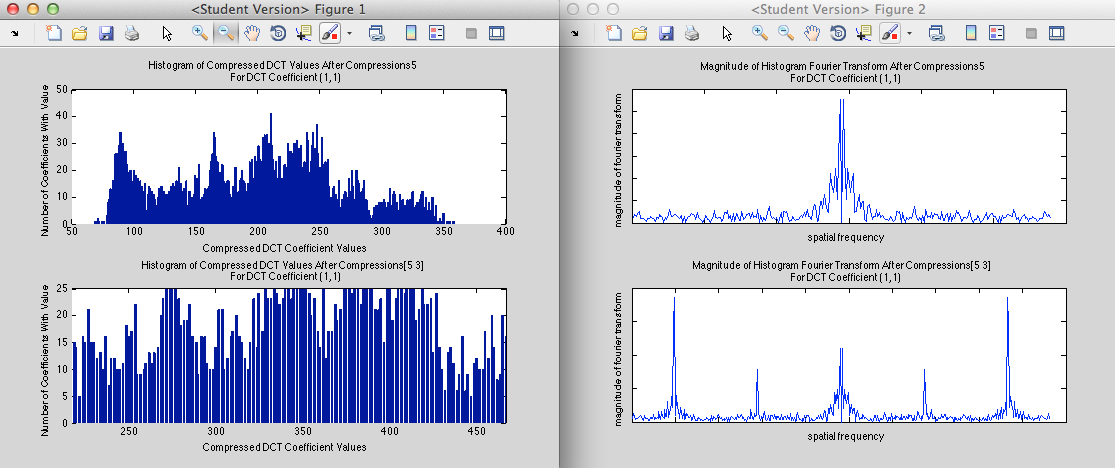
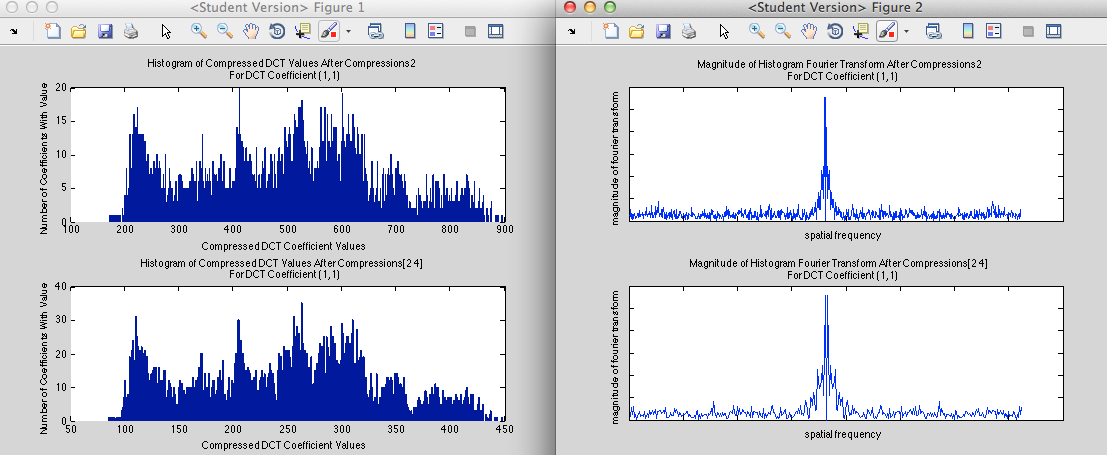
As expected, high compression followed by low compression results in some empty bins:
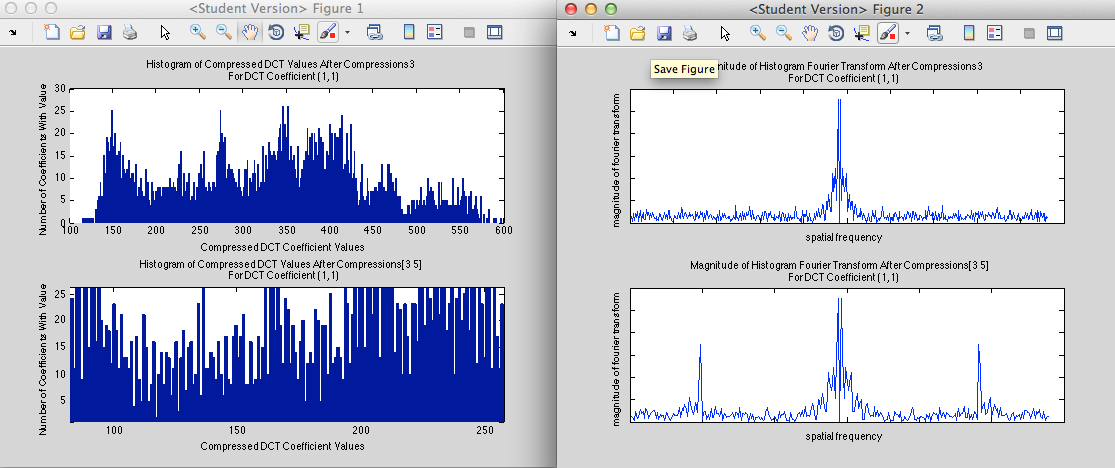
And low compression followed by high compression results in periodic bin population
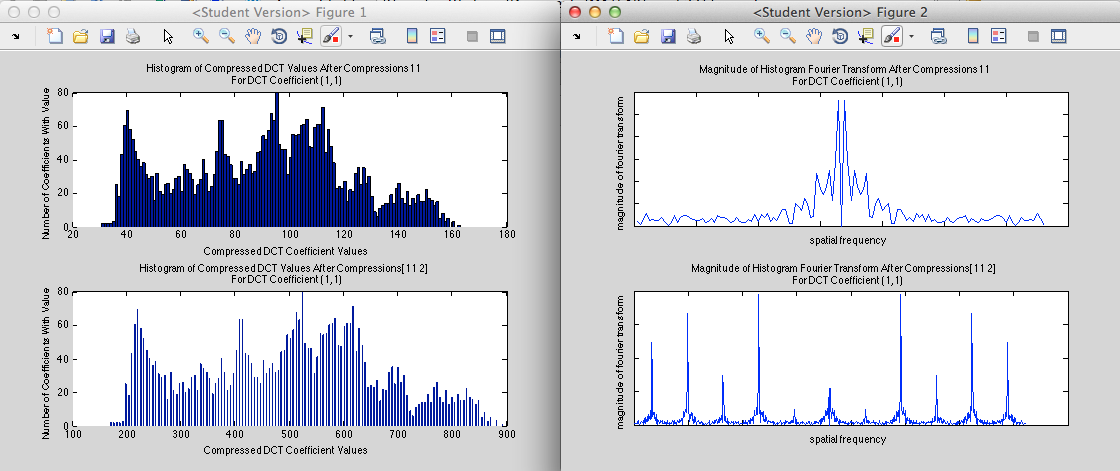
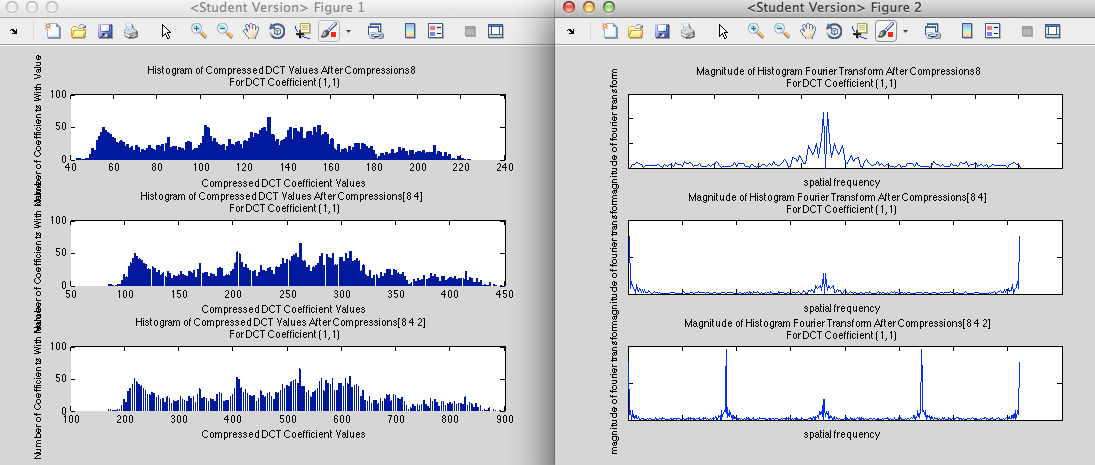
Among other patterns we may notice the following: The number of high frequency spikes scales as the number of times b goes into a
Thus we achieve fairly inconclusive results as b>>a
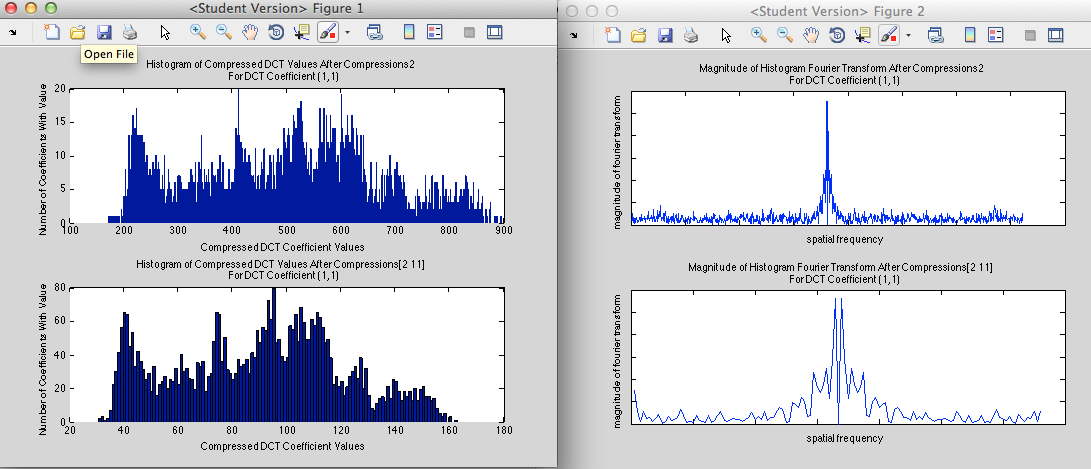
Another situation that reveals inconclusive data is if b/a = integer
It was also found that histogram shapes and Fourier shapes stayed the same when converting the image back and forth betweeen RGB and YCbCr formats in matlab.
Results of Simulating Triple Compression
I do not wish to overload the reader with graphs, but if he or she feels so inclined, I encourage him/her to test any combination of compression on an uncompressed image.
It should be noted though, that higher orders of compression almost always result in high frequency terms: even when a/b = integer and b/c = integer
Conclusions
The compression simulation could be a useful tool for image forensics workers to determine how many times an image has been compressed. It correctly simulates the Fourier artifacts that arise after different levels of compression. We can imagine a situation in which a Forensic analyst sees some random histogram of DCT coefficients and suspects some compression scheme. He could very easily apply the suspected compression scheme (or any other) to an uncompressed image to see if the Histograms have similar Fourier transforms. There are limitations to this software, though. As is pointed out in reference 1, if the second compression is evenly divisible by the first compression, nothing is detected. Also, if the uncompressed image has periodic coefficients to begin with (a rare but possible case), a detection scheme might get a false positive.
I would have liked to create a tool that takes in an image and determines if it has been compressed multiple times. I attempted to leverage the fact that the decompressed coefficients have some periodic nature, but this periodicity seemed inconclusive as far as I could tell. If one could replace the image reading and coefficient extraction with direct coefficient extraction from the .jpg file, I am confident that this would work within the bounds described above in results (i.e. b/a not equal to integer). This could also be done by working with a given quantization table. The roundabout method would be to decompress in matlab and recompress by the given quantization table.
If I were to continue working on this, I would try to extract the dct coefficients directly from the .jpg file (I found this very difficult for some reason). Professor Hany Farid supplied me with some .mex code to do it, but I could not get that to compile, nor could I find any way to access the .jpg file directly. Someone who has a better low-level understanding of computers would have better luck.
References
H. Farid, Dartmouth Department of Computer Science, Lectures at Stanford, Winter, 2013
[1] A.C. Popescu and H Farid "Statistical Tools for Digital Forensics." Provided by Stanford Psychology 221. Winter,2013
[2]H. Farid. "Image Forgery Detection: A Survey" IEEE Signal Processing Magazine. March 2009: 16-25
Appendix 1
Code for simulating multiple compression File:Multi Comp.zip
Inconclusive code for detecting patterns in decompressed coefficients
File:Testing.zip
![{\displaystyle x_{a}[u]=q_{a}(x[u])={\Bigg \lfloor }{\frac {u}{a}}{\Bigg \rfloor }}](https://wikimedia.org/api/rest_v1/media/math/render/svg/f437070c3de4a24d74005ae1c82889b6fbbbdb72)


![{\displaystyle x_{ab}[u]=q_{ab}(x[t])={\Bigg \lfloor }{\Bigg \lfloor }{\frac {u}{b}}{\Bigg \rfloor }{\frac {b}{a}}{\Bigg \rfloor }}](https://wikimedia.org/api/rest_v1/media/math/render/svg/80a303a00e06592bbb9a8b48e6473e5439ce35ca)


