HaomiaoJiang
Back to Psych 221 Projects 2013
Background
Display Characterization
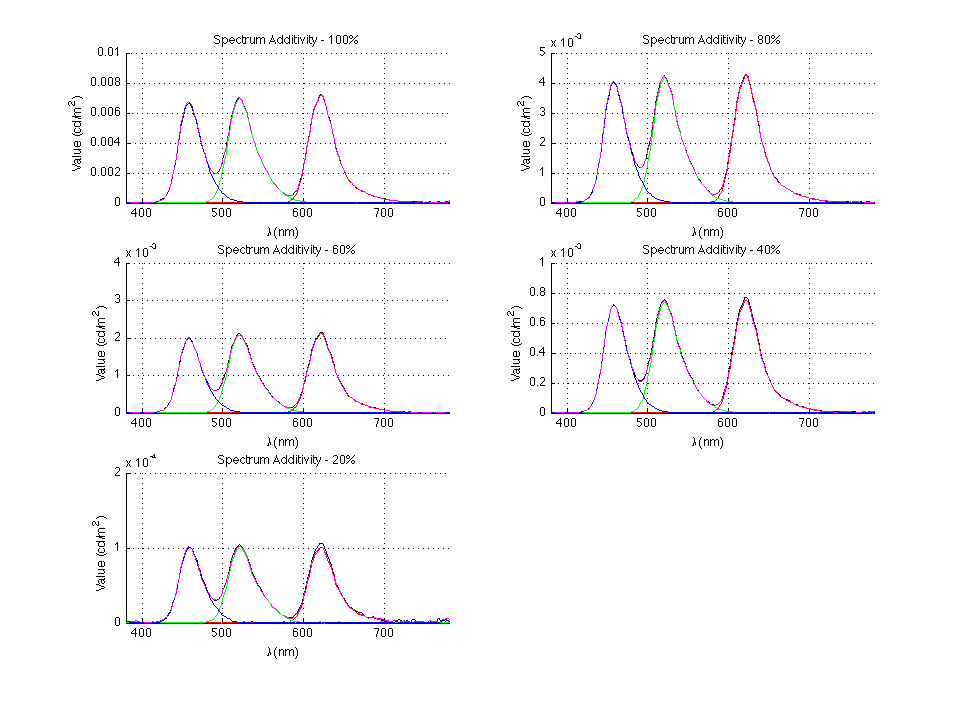
Display characterization is the process to build proper models for certain displays and estimate the underlying parameters. The display characteristics are usually measured in two categories, spatial properties and temporal properties. Spatial properties mainly include display gamma value, color bit depth, spectral power distribution, color spectral additivity, pixel independence and so on. Temporal properties include refresh rate, color breakup and so on. Among them, color bit-depth, refresh rate are given by the manufacture and these parameters will not vary a lot between displays. Also, shape of spectral power density is similar among LCD displays, which is shown in figure 1 below.
However, gamma values are different from display to display, even if they are from the same manufacture. So measuring or estimating the gamma for each display is essential in calibrating the display model.
Gamma Curve
Gamma curve characterize the relationship between the inputs value and the output luminance levels. Actually, this encodes and decodes luminance or tristimulus values in video or still image systems.
Gamma is also sometimes called gamma correction, gamma nonlinearity or gamma encoding. Mathematically, gamma correction is, in the simplest cases, defined by the power-law expression:
Since black is not purely black and there always more or less exists ambient lighting, we can add a constant term as
Usage in Vision Experiment
Measuring gamma value of display is essential in preparation of most of the vision experiments. With gamma value and spectral power distribution of the display, we can estimate the spectrum of light coming into the subjects eye. Then, we can transform the spectrum to XYZ or even other color space to do further processing. This process can be described by formular below
Here stands for the luminance of black and stands for the ambient lighting spectrum. These two terms can sometimes be ignored, assuming that we're working in dark room condition. Also, Spectral power distribution can somehow be estimated from the standard shape of LCD display. Thus, characterizing the gamma value is the critical point in output light estimation process.
Measuring Methods
Traditional Measuring Methods
Measuring Process
Traditionally, gamma values are measured by using spectrometer inside a dark room. Spectrometer is an instrument used to measure properties of light over a specific portion of the electromagnetic spectrum. With the spectrum in visible range, luminance values can also be calibrated by computing the XYZ.
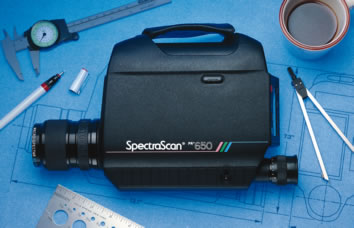
Commonly used spectrometers include PR650 and PR715. An image for PR650 is shown in figure 2 below.
The calibration process is described as below:
- Stabilize spectrometer on a tripod and focus it on screen
- Display a flat patch on screen
- Take measurement of XYZ value (Save Y only)
- Change brightness levels and redo step 3
To calibrate display with PR650, you can use code from PsychToolbox or from dmToolbox. Detailed instructions about steps and calling APIs can be found at Vista Lab Wiki Page and pdc wiki correspondingly.
Deficiencies
Dithering Methods
Subjects were 5 healthy volunteers.
Online Dithering Test
Data were obtained on a GE scanner. Et cetera.
Test Results
Subjects and Test Environment
Some text. Some analysis. Some figures.
Dithering Method Test Results
Some text. Some analysis. Some figures.
Online Dithering Test Results
Some text. Some analysis. Some figures. Maybe some equations.
Analysis and Comments
Limitations
Influential Factors
Conclusions
Here is where you say what your results mean.
References
Software


