KonradMolner
Introduction
Motivate the problem. Describe what has been done in the past.
Background
What is known from the literature.
Methods
Describe techniques you used to measure and analyze. Describe the instruments, and experimental procedures in enough detail so that someone could repeat your analysis. What software did you use? What was the idea of the algorithms and data analysis?
Results
In the following image we present the input stimuli presented to the eye from 0º to 1º rotations in 0.2º increments, from left to right. The top stimuli is 4m from the camera and the bottom stimuli is 25cm from the camera. Note the increasing horizontal disparity between the two stimuli as the eye rotation increases.

After passing these stimuli through our model for the eye, we observe the following series of images.

The following shows the observed cone absorbances on the fovea.

We locate the horizontal centroid of the line stimuli, in units of cones, with the following black and white image.

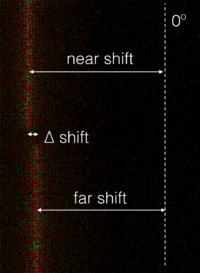
In the table below, we calculate the horizontal displacement from the 0º stimuli in units of cones, as well as the change in disparity between the near and far stimuli.
| Horizontal Eye Rotation | 0.2º | 0.4º | 0.6º | 0.8º | 1º |
|---|---|---|---|---|---|
| Near stimulus shift from 0º | 24.22 Cones | 49.40 Cones | 73.45 Cones | 97.46 Cones | 122.62 Cones |
| Far stimulus shift from 0º | 23.08 Cones | 46.40 Cones | 69.45 Cones | 92.50 Cones | 115.67 Cones |
| ∆ shift from near to far stimuli | 1.14 Cones | 3.01 Cones | 4.00 Cones | 4.69 Cones | 6.95 Cones |
The displacement calculations are illustrated in the following graphics:

Conclusions
In Comparison to the pupil
Assuming an eye radius of 12mm and a 1º microsaccade, only 0.209mm of parallax are generated on the pupil. This 0.209mm of parallax corresponds to the 6.95 cone shift between the near and far stimuli in our simulation.
We hypothesize that the 4mm of parallax generated across the pupil, assuming a pinhole camera model at the limits of the pupil, serve as a much stronger depth cue than the parallax observed during a microsaccade. In future work, we look to simulate the parallax observed across the pupil opening alone, in units of cones, for better comparison with our microsaccade simulation.
Hacking the visual system
Our simulation of the retinal disparity due to a microsaccade looked to evaluate the amount of parallax one experiences when examining the natural, static world, with the same eye optics as when wearing a VR headset. While we certainly observed horizontal parallax and believe that this could serve as a depth cue for accommodation, the parallax across the pupil opening was much larger, indicating that it is a stronger depth cue than parallax during a microsaccade.
In contrast to the real world, VR displays allow us to project different images onto the eye at any point in time. If a rendering engine knew when the eye was microsaccading, successive video frames with greater horizontal disparity than normal could be shown, forcing stronger parallax across the retina, and therefore driving accommodation more aggressively than typically experienced. The strength to which this could serve as the accommodation could be adjusted, based on the content in the scene, and to the depth that would alleviate vergence-accommodation strains.
Appendix I
Upload source code, test images, etc, and give a description of each link. In some cases, your acquired data may be too large to store practically. In this case, use your judgement (or consult one of us) and only link the most relevant data. Be sure to describe the purpose of your code and to edit the code for clarity. The purpose of placing the code online is to allow others to verify your methods and to learn from your ideas.
Appendix II
(for groups only) - Work breakdown. Explain how the project work was divided among group members.