Uncategorized files
Jump to navigation
Jump to search
Showing below up to 50 results in range #51 to #100.
-
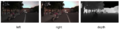
 161055 lens.jpg 189 × 252; 8 KB
-
 161055 raw.jpg 189 × 252; 7 KB
-
 161310 lens.jpg 189 × 252; 6 KB
-
 161310 raw.jpg 189 × 252; 7 KB
-
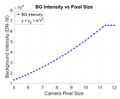 16 BG intensity.JPG 654 × 537; 34 KB
-
 17. Multivariate least-squares deconvolution.png 397 × 270; 24 KB
-
 17. Reflectance Spectra of stomach 29 min after ischemia.png 513 × 389; 12 KB
-
 17.png 1,367 × 666; 229 KB
-
 173503 lens.jpg 336 × 252; 21 KB
-
 173503 raw.jpg 336 × 252; 23 KB
-
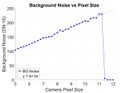 17 BG Noise.JPG 672 × 520; 34 KB
-
 18. Multivariate least-squares deconvolution.png 786 × 319; 56 KB
-
 18. Reflectance Spectra of stomach 13 min after perfusion.png 503 × 385; 12 KB
-
 18.png 1,367 × 645; 101 KB
-
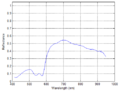
 19. Reflectance Spectrum of stomach before ischemia.png 504 × 385; 13 KB
-
 19.png 1,367 × 666; 179 KB
-
 198 comp new.png 1,972 × 560; 2.11 MB
-
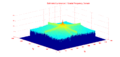
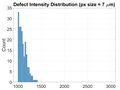 19 Defect Intensity 7um.JPG 914 × 688; 48 KB
-
 1 2000 delta.png 460 × 385; 494 KB
-
 1 2000 orig.png 479 × 401; 298 KB
-
 1 Intro.JPG 1,583 × 498; 84 KB
-
 1 chart.png 907 × 160; 26 KB
-
 1 psych221.jpg 256 × 239; 13 KB
-
 1f.jpg 479 × 477; 105 KB
-
 1s.jpg 472 × 470; 103 KB
-
 1t.jpg 477 × 474; 103 KB
-
 2-1.png 1,120 × 840; 954 KB
-
 2-4.png 1,120 × 840; 967 KB
-
 2.Photon Tissue Interaction.png 828 × 437; 20 KB
-
 2. Graphic depiction of saturation algorithm.png 532 × 442; 67 KB
-
 2.jpg 1,680 × 1,020; 181 KB
-
2.pdf File missing
-
 2.png 1,082 × 304; 265 KB
-
 20. Reflectance Spectrum of stomach 12 min after ischemia.png 509 × 386; 13 KB
-
 20.png 1,367 × 645; 55 KB
-
2012LewPhong WaveOpticsToolbox.zip File missing
-
 201 motion.png 728 × 655; 100 KB
-
 202 motion.png 786 × 658; 119 KB
-
 20Fascicles.png 1,349 × 816; 481 KB
-
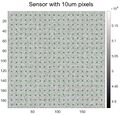 20 Sensor with 10um pixel.JPG 746 × 717; 112 KB
-
 20 Steps Quantized Picture Rendering.png 438 × 347; 254 KB
-
 20 Steps Quantized Step plot.png 477 × 404; 48 KB
-
20 flash sequences.zip File missing
-
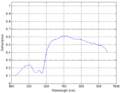 21. Reflectance Spectrum of stomach 29 min after ischemia.png 497 × 384; 13 KB
-
 21.png 1,367 × 666; 72 KB
-
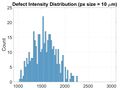 21 Defect Intensity 10um.JPG 910 × 685; 62 KB
-
 22. Reflectance Spectrum of stomach 13 min after perfusion.png 501 × 384; 13 KB
-
 22.png 1,367 × 666; 206 KB
-
 221 dataset.png 802 × 200; 178 KB
-
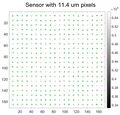 22 Sensor with 11um pixel.JPG 754 × 721; 70 KB


