Algorithms for calculating the Oxygen concentration in pig organs using Hyperspectral Images (Ye Tian)
Introduction

What is Hyperspectral Imaging?
The hyperspectral imaging is a image-data technology based on a large number of small bands. It is capable of gather and process information as a set of images which represents a range of the electromagnetic spectrum. Similar as the human eye observes things with three spectral bands (red, green, and blue), this technology combines these images together and form a three-dimensional hyperspectral data cube for analysis. The spectral resolution and spatial resolution are two typical parameters measuring the precision of hyperspectral sensors. The Figure 1 shows a picture of hyperspectral imager/camera that was taking pictures of a porcine during a surgery. Reflectance spectroscopy of the hyperspectral imaging measures the intensity of light reflected from a sample over a spectral range of interest.
How does photon interact with tissue?

The photons of light have the wave-particle duality. When coming across solid matters, they should be considered as elementary particles. Thus, in the optical imaging system, photons can interact with bodily tissues in six different ways. In transmission, photons passes through the tissue without any interaction. In reflection, photons are reflected back to the opposite direction without any energy loss. In refraction, the propagating directions of the photons are changed due to the change in refraction index. In scattering, photons colliding with tissue particles results in changes in both propagating direction and energy. In absorption, photons are totally absorbed by tissue particles. In fluorescence, part of photons' energy is absorbed by tissue particles and thus the wavelength of the emitted photon become longer. Because different tissue compounds absorb, scatter, and reflect light differently at various wavelengths, associating each tissue compound with a unique spectral signature, a spectrum.
Why do we need hyperspectral imaging system in medical surgeries?

During surgeries, it is quite often that doctors have to stop the blood circulation to a few targeted tissues on purpose. This procedure is achieved by using mosquito forceps to clamp the vessels. For example, during heart transplantations, a Heart-Lung Machine (HLM) is essential to temporarily takes over the function of the heart and lungs to support the blood circulation and the oxygen supply of the whole body. There is a unavoidable time window between the stop of heartbeats and the favorably functioning of the HLM. During this period, the blood and hence oxygen supply to almost all the organs are cut off. As a result, the shortage of oxygen and glucose causes tissues to enter the ischemia state. For the worst cases, if the period is too long, tissues could begin to die. In those cases, it is relatively easy for experienced doctors to avoid. However, if doctors accidentally clamp some extra vessels without anyone noticing it, the tissues could suffer severe damages after a while. That is because the differences between normal tissues and ischemia tissues are very difficult for human eyes to observe. Fig. 1 shows a pig kidney before and during ischemia. (Ref.4) During intense surgeries, the probability of discovering this problem by doctors or nurses would not be good. Therefore, some better methods should be applied to monitor the blood and oxygen supply of tissues. So, what can we do to avoid ischemia without relying on our eyes?

Nowadays all kinds of imaging systems have provide us with a lot of powerful and reliable equipment in many areas from medical devices to research tools. Using some kind of imaging system to monitor the status of tissues and measure its oxygen level at any moment will of course reduce the surgery risk. But among the existing imaging techniques, which one is a proper candidate? Now let's have a brief look at four common categories of imaging technologies, including the Magnetic Resonance Imaging (MRI), the radionuclide imaging, the Photoacoustic imaging, and the optical imaging. First, the MRI is a non-invasive imaging technique by non-ionizing magnetic fields. The patient has to be put into a powerful magnet generating a static magnetic field of several Tesla to obtain MRI images. As a result, it is not practical to use MRI scanners during surgeries. Second, the Positron Emission Tomography (PET) is a typical radionuclide imaging. As shown in Figure 4, the PET scanner is as big as the MRI scanner. Besides, there will be a strong radioactivity when the PET scanner is running. This is a big threat to patients as well as doctors and nurses. It is not a proper candidate, either. Third, the Photoacoustic imaging is based on the Photoacoustic effect, the conversion of photons to acoustic waves. Ultrasound scanner, a typical modality, is able to reach a bigger depth of penetration than the previous scanners. However, since the patients' chest is usually opened and the tissue is exposed, Photoacoustic imaging can apply its talents nowhere. Finally, as shown in Figure 1, the hyperspectral camera can be easily installed to monitor the tissue of patients (pig in this case). In addition, as mentioned above, because every tissue compound has a unique spectral signature, by analyzing the reflectance spectrum of the tissue, we should be able to analyze what compounds exist in the tissue and how much they remain. To sum up, hyperspectral imaging is a proper candidate to assist medical surgeries.
Research / Method
The hyperspectral images of different tissue compounds usually have their own 'signatures' at certain frequencies. This property provides a potential approach to distinguish these tissues in a much bigger wavelength band than that of a human eye. Besides that, under normal tissues' surfaces there are usually plenty vessels spreading. Although the oxygen content in those vessels will not cause a significant difference in the human visual system, at certain invisible wavelengths, the differences would be quite obvious.
Three important chemical composition in tissues
Tissues are consisted of many different chemical compositions, each of which usually has a unique absorption spectrum. Therefore, it is very difficult to analyze all the compositions. However, lucky for us, there is no necessary to perform analysis to all of them for two reasons. First, many compounds only exists in a minute amount in the tissues. Thus, their absorption do not play significant roles in the actual spectrum. Second, the compounds that only has large amounts in the deep tissues do not have any chance to interact with photons. As a result, there is no need to consider them. To sum up, only the compounds that abundantly accumulate at the surface of the tissue needs our concerns.
Based on the criteria above, water, hemoglobin, and lipids should be focused on. Firstly, about 65 percents of human body is water. Besides, it is important to recognize the importance of water absorption especially in the blood. Secondly, The oxygen existing in human bodies can be in forms of molecular oxygen, free radicals, or oxidation products. Among all these compositions, oxyhemoglobin (HbO2) is the principle method of transport for oxygen in the blood. Hemoglobin (Hb) is the iron-containing oxygen-transport metalloprotein in the red blood cells. Each hemoglobin is capable of carrying up to four oxygen melecules from lungs to the rest of the body. Based on the oxygenization, they can be divided into oxyhemoglobin and deoxyhemoglobin. Since they have a few significant differences in certain bands, they are the most important indicator which can help us determine the oxygen concentration. Finally, there are many types of lipids. Some lipids have functions of covering the surfaces of the organs. When photons travel deep in tissues, near-infrared (NIR) light is known to sample significant absorbance regions in the spectra of Hb, HbO2, water, and lipid, inherent tissue chromophores, that can be used for differentiating anatomical structures based on their chemical composition.(Ref.6)
The explanation to the reflectance spectra of some different tissues

At the same time, there are quite a few critical issues that prevent hyperspectral imaging from mature applications. The main problem comes from the difficulty of lacking of enough data to plot the baselines of different tissues' responses. As shown in Fig. 8, there are some similarities and distinctions between those tissues.
Why are the reflectance spectra of all tissues so small below 400 and above 1000 nm
According to the absorption spectrum of water in Figure 5, wavelengths below 200 nm and above 900 nm are generally useless because the absorption by water is too strong. As you can see from the reflectance spectra of several tissue in Figure 8, the reflectance of those tissues decrease below 0.1 as expected.
Similarities in the shape at wavelength between 500 and 600 nm
As you can see, the reflectance of most tissues exhibit two minima and one maximum. This is due to the existence of two important compositions in the blood, deoxyhemoglobin (Hb) and oxyhemoglobin (HbO2). The absorption spectrum peaks at 541 and 576 nm for HbO2 and a single peak at 555 nm for pure deoxy-Hb.
Abnormal spectra - spleen
The spleen is the biggest lymphoid organ in the human body. It produces many different kinds of immunizing cells, including granulocyte.
The granulocyte enzyme has an absorbance peak around 570 nm. It helps smooth the reflectance spectral of the spleen below 600 nm.
Wavelength between 700 and 1000 nm
Venous structures had absorption peaks at 760 nm (Hb), 800 nm (HbO2), and 970 nm (water). Arterial vessels had absorption peaks at 800 nm and 970 nm that would be expected for HbO2 and water.
Based on the choice of spectra and the type of tissues, there are several available hyperspectral algorithm to calculate the oxygenation status.
-
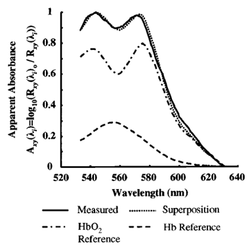
Figure 6: Hemoglobin absorption spectrum between 500 and 600 nm (Ref.6)
-
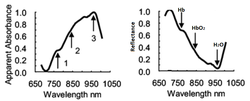
Figure 7: Hemoglobin absorption spectrum above 700 nm (Ref.5)
-
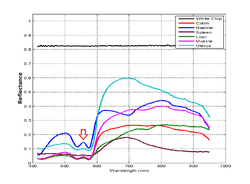
Figure 8: The reflectance spectra of different tissues (Ref.8)
-
Figure 9: Multivariate least-squares deconvolution (Ref.7)


Multivariate least-squares regression analysis (Ref.7)
In this method, spectral images, based upon oxyhemoglobin and deoxyhemoblobin signals in the 525-645 nm region, are deconvoluted using a multivariate least-squares regression analysis to visualize the spatial distribution of the percentages of oxyhemoglobin and deoxyhemoglobin in specific skin tissue areas.(Ref.6) Oximetry is an alytical approach for assessing blood flow through the vascular bed of a tissue by monitoring the visible and near-infrared spectral properties of blood.(Ref.6)
Spectral Reference Sample Preparation
Because reference spectra are essential to deconvolute the observed visible reflectance spectra into percentages of HbO2 and deoxy-Hb.(Ref.6) Pure HbO2 and deoxy-Hb samples were prepared by standard methods. The resulting reference spectra were measured using the visible reflectance hyperspectral imaging system, with characteristic peaks at 541 and 576 nm for HbO2 and a single peak at 555 nm for deoxy-Hb, as shown in Figure 6.(Ref.6)
Data Acquisition
Each hyperspectral image cube should consist of many individual images, collected from 525 to 645 nm in uniform increments.
Data Analysis
The percentage of HbO2 can be calculated in two steps. First, the measured visible reflectance spectra are quantified in terms of apparent absorbance, Axy(r_i) a ratio between reflected sample radiation, Rxy(r_i), and the reflected radiation from a certified 99.9% reflectance standard Rxy(r_i):
(1)
![{\displaystyle A_{xy}(r_{i})=log[R_{xy}(r_{i})_{o}/R_{xy}(r_{i})]}](https://wikimedia.org/api/rest_v1/media/math/render/svg/d1df2c40d2e2877fe379abc3836758a8ef75a3b1)
where r_i is wavelength.
In the second step, the apparent absorbance spectra, a convolution of the HbO2 and deoxy-Hb, are transformed to the percentage of HbO2 by deconvoluting the measured spectra into two intrinsic components.(Ref.6) The multivariate regression of the spectrum at pixel position (x, y) is given by
(2)

where C is a linear, multidimensional, deconvoluted contribution matrix composed of k pure components.
The sensitivity matrix, S, is given by
(3)

where P is the matrix of pure component spectra and t represents the transpose operation.
Using the pure component reference spectra of fully oxygenated hemoglobin and completely desaturated hemoglobin and substituting equation (2) into equation (1), one establishes a determination of the percentage of HbO2 at each sampling area.(Ref.6) Figure 6 displays a representative measured spectrum (solid line), its weighted percentages of the reference spectra (dot-dash line HbO2; dash line Hb) determined by the multivariate regression and the resulting superposition spectrum (dotted line).(Ref.6)
Tissue Oxygen Saturation Algorithm (Ref.8)

This hyperspectral algorithm is based on the computational estimates of spectral feature amplitudes in hyperspectral images. For this project, the spectra between 520 nm and 645 nm were chosen because they incorporate the reflectance values of both oxyhemoglobin (HbO2) and deoxyhemoglobin (Hb). This algorithm is usually used to evaluate oxygen saturation responses of the optic nerve head (ONH) and overlying retinal vessels in a primate model of glaucoma. Here, I would to explore the possibility of extending this algorithm's scope of application.
S02 - dependent component
According to the experiment, there are four isosbestic points on the reflectance curve whose corresponding wavelengths are 522 nm, 548 nm, 569 nm, and 586 nm. (See Fig. 2) They are insensitive to changes of oxygen saturation of the blood, a reference baseline can be linear interpolated from them. An expression for an oxygensensitive vector s can be obtained from areas between the recorded curve and baseline within the three oxygen-sensitive bands. The dependent vector s is

Correction for blood volume
Volume corrections based on reflectometry at multiple wavelengths exist and can be employed with hyperspectral imagery. Using such a method, Delori showed that an index of tissue blood volume, V, near the surface of the optic disc can be expressed in a single dimension (cm) after normalization by a fixed density per square area (cm^2). The expression for the blood volume index is:

Relative Saturation Index for oxygen percentage
A relative index for SO2, which is corrected for light intensity differences and for blood volume, is:

This index represents the relative concentration of hemoglobin in the red blood cells.
Result
In this experiment I chose to implement the tissue oxygen saturation algorithm using ISET. There were two sets of hyperspectral images. The first set includes four hyperspectral images of a porcine stomach before ischemia, 12 min after ischemia, 29 min after ischemia and 13 min after perfusion. The second set includes three hyperspectral images of a porcine colon before ischemia, 16 min after ischemia and 30 min after ischemia.
Porcine Stomach
As you can see in Gallery 1, due to inevitable surgery operations, the locations of the stomach in Figure 12, 13 and 14 , which are quite the same, are apparent to departure from the stomach in Figure 11. Besides that, the figure 11 is a little brighter than the figure 12, 13, and 14. In order to achieve the best result in the experiment, it is preferable that the positions on the stomach in the four figures, which are chosen to samples their reflectance spectra, should be as close as possible. In this way, the experimental errors could be minimized.
- Gallery 1: Hyperspectral images of a porcine stomach
-
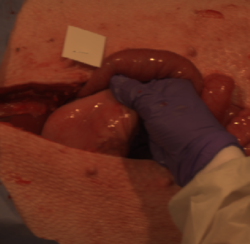
Figure 11: Stomach image Before ischemia (Ref.11)
-
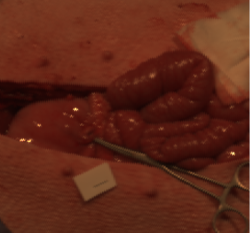
Figure 12: Stomach image 12min after ischemia (Ref.11)
-
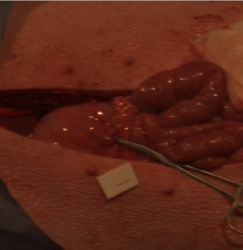
Figure 13: Stomach image 29 min after ischemia (Ref.11)
-
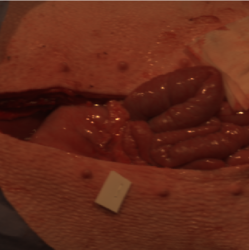
Figure 14. Stomach image 13 min after Perfusion (Ref.11)


The four figures in Gallery 2 display the reflectance spectra of the four white cards in the four stomach figures in Gallery 1, respectively. The four curves of the reflectance spectra are generally uniform, which are desired to improve the experimental accuracy. The differences between the reflectance spectra before ischemia and the rest three spectra are applied to modify the reflectance spectra on the stomach surfaces.
- Gallery 2: Reflectance spectra of white cards in the hyperspectral images of a porcine stomach
-
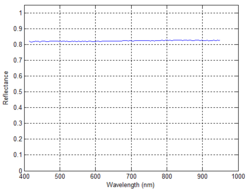
Figure 15: Reflectance Spectra of white cards in the hyperspectral images of stomach before ischemia
-
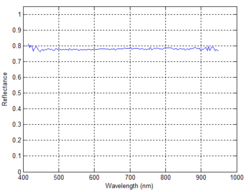
Figure 16: Reflectance Spectra of white cards in the hyperspectral images of stomach 12 min after ischemia
-

Figure 17: Reflectance Spectra of white cards in the hyperspectral images of stomach 29 min after ischemia
-

Figure 18: Reflectance Spectra of white cards in the hyperspectral images of stomach 13 min after perfusion


In Figure 19, 20, 21, and 22, the reflectance spectra of the stomach surfaces have the similar curve shapes, which are consistent with the reflectance spectra of different tissues in Figure 8. Although the figure 8 does not have a sample for the stomach, it seems the shape of the stomach is a combination of the shapes of the bladder and uterus. The stomach's shape below 600 nm is close to the one of bladder and its shape above 600 nm is similar to the uterus. I think a good explanation is their physiological functions. The stomach and bladder are both some kind of containers in human body. Their strata externum very thin and are spread with blood vessels and their endothecium are several layers of muscles. As a result, the influence due to the oxyhemoglobin and deoxyhemoglobin between 500 and 600 nm are more significant compared to other tissues.
- Gallery 3: Reflectance spectra of the hyperspectral images of a porcine stomach
-
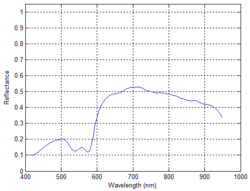
Figure 19: Reflectance Spectrum of stomach before ischemia
-
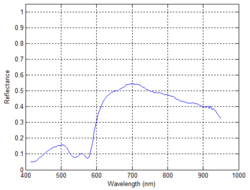
Figure 20: Reflectance Spectrum of stomach 12 min after ischemia
-
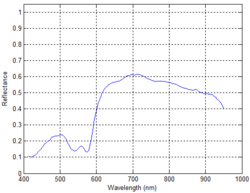
Figure 21: Reflectance Spectrum of stomach 29 min after ischemia
-
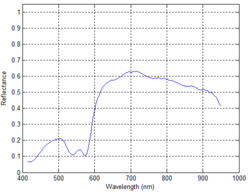
Figure 22: Reflectance Spectrum of stomach 13 min after perfusion


By plotting the four curves from Gallery 3 in only one graph, it is easier to have a visual comparison between them. According to Figure 23, the four reflectance spectra are very close within the band whose wavelengths are below 600 nm, but their differences become remarkable above 600 nm. By zooming into the band from 500 nm to 600 nm, we get a better observation of their characteristics that are illustrated in Figure 10. At 528, 553, 568, and 580 nm, the red, green, and black curves seems to intersect. However, the blue line is generally a little higher than the other three throughout this band. Finally, with respect to the stomach image before ischemia, the RSI of the stomach 12 min after ischemia is 2.8016, the RSI of the stomach 29 min after ischemia is -8.7474, and the RSI of the stomach 13 min after perfusion is 1.0238.
- Gallery 4: Reflectance spectra of the hyperspectral images of a porcine stomach at four statuses
-
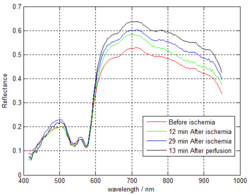
Figure 23: Reflectance spectra of the stomach at four statuses
-
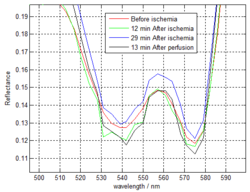
Figure 24: Reflectance spectra of the stomach at four status (zoom in) 1
-
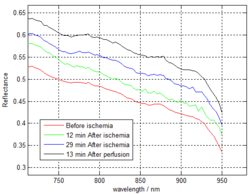
Figure 25: Reflectance spectra of the stomach at four status (zoom in) 2

_1.png)
_2.png)
Porcine Colon
In Gallery 5, the locations of the colon in Figure 26, 27 and 28, were kept very similar. However, the figure 26 is darker than the figure 27 and 28. Similar to the procedures in the previous task, the positions on the colon in the three figures are chosen to be the same to sample their reflectance spectra.
- Gallery 5: Hyperspectral images of a porcine colon
-
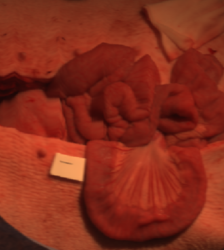
Figure 26: Porcine Colon before ischemia (Ref.11)
-
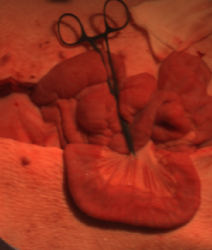
Figure 27: Porcine Colon after 16 min ischemia (Ref.11)
-
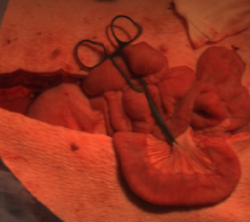
Figure 28: Porcine Colon after 30 min ischemia (Ref.11)


Because only the first hyperspectral image has a white card as a reference, for this part of the experiment, the inner skin of the pig was chosen as references. The differences between the reflectance spectra before ischemia and the other two spectra are applied to modify the reflectance spectra on the stomach surfaces. Simply judging by eyes, the differences are much larger than the differences for the stomach references.
- Gallery 6: Reflectance spectra of pig skin in the hyperspectral images of a porcine colon
-
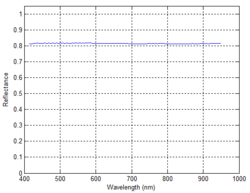
Figure 28: Reflectance Spectra across the White Card in Figure 26
-

Figure 29: Reflectance Spectra across the Porcine Skin before ischemia in Figure 26
-
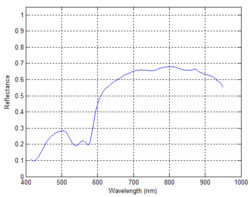
Figure 30: Reflectance Spectra across the Porcine Skin after 16 min ischemia in Figure 27
-
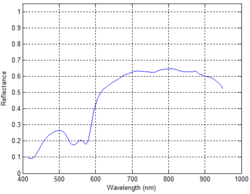
Figure 31: Reflectance Spectra across the Porcine Skin after 30 min ischemia in Figure 28


In Figure 32, 33, and 34, the reflectance spectra of the colon surfaces have the similar curve shapes. The figure 32 seems to be more close to the example curve in Figure 8.
- Gallery 7: Reflectance spectra of the hyperspectral images of a porcine colon
-
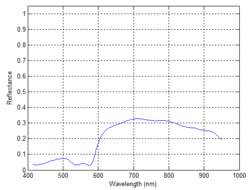
Figure 32: Reflectance Spectra across the Porcine Colon before ischemia
-
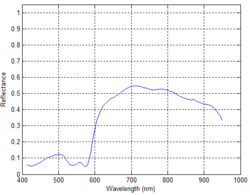
Figure 33: Reflectance Spectra across the Porcine Colon after 16 min ischemia
-
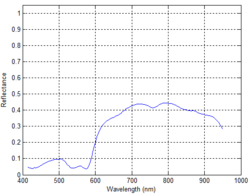
Figure 34: Reflectance Spectra across the Porcine Colon after 30 min ischemia


By plotting the four curves from Gallery 7 in only one graph, it is easier to have a visual comparison between them. At 527, 550, 565, and 583 nm, the black and blue curves intersect. The red curve is bigger than both of them. Finally, with respect to the colon image before ischemia, the RSI of the colon 16 min after ischemia is 46.7422, the RSI of the colon 30 min after ischemia is 42.9930.
- Gallery 8: Reflectance spectra of the hyperspectral images of a porcine colon at three statuses
-
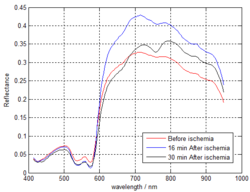
Figure 35: Reflectance spectra of the colon at three statuses
-
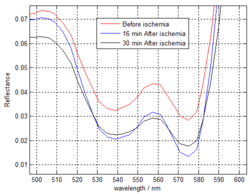
Figure 36: Reflectance spectra of the colon at three status (zoom in) 1
-
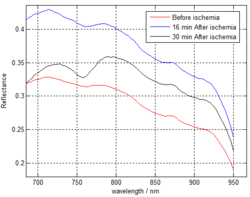
Figure 37: Reflectance spectra of the colon at three status (zoom in) 2

_1.png)
_2.png)
Conclusions
In this project, I thought there was a potential market of the hyperspectral imaging in medical surgeries. Two interesting algorithms for calculating the oxygen saturation percentages in tissues were investigated. One of them is called the tissue Oxygen Saturation algorithm which has been approved in evaluating oxygen saturation responses of the optic nerve head. By implementing this algorithm to a porcine stomach and colon with ISET, I think that although the final results do not turn out very good, there are still some similar observations in Figure 24 and 36. By improving the qualities of the hyperspectral images and modifying some insensitive wavelengths based on each tissue, it might be possible to achieve the desired performance of this algorithm.
The second algorithm is using a multivariate least-squares regression analysis to visualize the spatial distribution of the percentages of oxyhemoglobin and deoxyhemoglobin. Compared to the first one, so far it has a wider applicability for many different tissues. In the future, implementing it using ISET could be useful and may achieve a better result than the ones I got in this project.
Reference
[1] Sara L. Best, Abhas Thapa, et al.,'Assessment of Renal Oxygenation During Partial Nephrectomy Using Hyperspectral Imaging'.
[2] Chad R. Tracy, M.D., et al., 'Characterization of renal ischemia using DLP hyperspectral imaging a pilot study comparing artery-only occlusion versus artery and vein occlusion'.
[3] Jay D. Raman, Karim Bensalah, et al., 'A comparison of kidney oxygenation profiles between partial and complete renal artery clamping during nephron sparing surgery in a porcine model'.
[4] Karel J. Zuzak, Robert P. Francis, et al., 'DLP hyperspectral imaging for surgical and clinical utility'.
[5] Karel J. Zuzak, Sabira C. Naik, et al., 'Intraoperative bile duct visualization using near-infrared hyperspectral video imaging'.
[6] Karel J. Zuzak, Sabira C. Naik, et al., 'Characterization of a near-infrared laparoscopic hyperspectral imaging system for minimally invasive surgery'.
[7] Karel J. Zuzak, Michael D. Schaeberle, et al., 'Visible reflectance hyperspectral imaging characterization of a noninvasive in vivo system for determining tissue perfusion'.
[8] James M. Beach, JinFeng Ning, et al., 'Hyperspectral Algorithm for Mapping Tissue Oxygen Saturation'.
[9] Wikipedia, 'Electromagnetic absorption by water'. http://en.wikipedia.org/wiki/Electromagnetic_absorption_by_water
[10] Adam de la Zerda, 'Optical Imaging'.
[11] Hyperspectral Images supplied by Joyce Farrell.
Appendix I
Scripts
File:StomachOx.zip
File:ColonOx.zip
Figure
File:Stomach Figures for code 'StomachOx'.zip
File:Colon Figures for code 'ColonOx'.zip
File:Figures.zip
Slide
File:The influence of Blood oxygen concentrations on hyperspectral images of different tissues.pdf
Appendix II
Ye Tian is responsible for all the materials on this website Algorithms for calculating the Oxygen concentration in pig organs using Hyperspectral Images (Ye Tian),including the attached ISET codes. Besides that, Ye Tian did a 10-minute presentation.
Xiaoxiong Lu is responsible for all the materials on the website An Overview of Hyperspectral Colon Tissue Cell Classification. He did a 10-minute presentation about it.