Medical imaging: Simulations of reflectance and fluorescence of human tissue
Introduction
Squamous dysplasia, a precursor to squamous cell carcinoma, represents a spectrum of histological alterations within the epithelium, characterized by abnormal cellular morphology and metabolism. Early identification is critical to prevent the progression to invasive carcinoma. Auto fluorescent imaging (AFI) has emerged as a promising non-invasive technique for the detection of squamous dysplasia. Flavin adenine dinucleotide (FAD), an essential co-factor in cellular oxidative metabolism, undergoes changes in concentration and redox state during dysplastic transformations. Studies indicate a correlation between dysplastic progression and altered FAD levels, leading to variations in tissue fluorescence. Lower FAD concentrations in dysplastic areas manifest as decreased fluorescence intensity level, which in principle can be imaged with AFI.
AFI uses the intrinsic fluorescent properties of endogenous molecules within tissues. Under appropriate excitation wavelengths, endogenous fluorophores emit light, providing real-time visualization of tissue morphology. The altered metabolic activity and subsequent changes in FAD concentrations in dysplastic tissues offer a distinct fluorescence pattern that is in principle discernible through AFI.
In clinical settings, AFI demonstrates promise as a non-invasive tool for identifying early dysplastic lesions. Its ability to highlight subtle changes in tissue autofluorescence can aid in targeted biopsies and delineation of margins during surgical interventions. In this project, we explore imaging of dysplastic tissues by using optical Monte Carlo based fluorescence simulations. We identify qualitative trends of image quality with respect to dysplastic lesion size, depth, and fluorophore concentration change. Understanding how photons interact with fluorophores, the probability of excitation, and the emitted fluorescence intensity can assist in predicting and interpreting experimental fluorescence measurements.
Background
Optical Processes in Skin Tissue
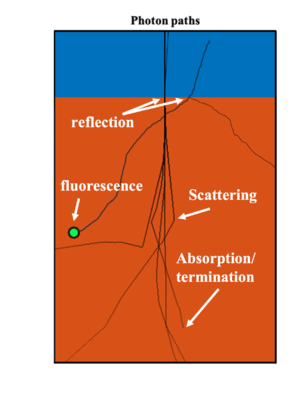
When shining light into the skin, there are multiple light-matter interaction processes happening simultaneously, including reflection, absorption, scattering, and fluorescence as depicted in the figure below.
The key process in this study is fluorescence. When short wavelength photon is absorbed, the material will re-emit photon at a longer wavelength and smaller energy. In the epidermis layer of the skin tissue, there are two fluorescence molecules, FAD and NADH, which are related to metabolic activities of cells. By measuring the fluorescence activities, one can monitor the localized concentration of FAD and NADH in the epidermis layer, therefore acquiring early signs on potnetial dysplasia. To model the fluorescence activities in the epidermis layer, the fluorophore is assumed to be uniformly distributed in the epidermis layer as a solution while the dysplastic region can be regarded as some localized volume with a different concentration comparing to the surrounding medium.
Reflection refers to the back-scatter of photon at the interface between different materials when the index of refraction changes. Since the main composition of human skin is water, the variation of index of refraction is minor therefore there is negligible amount of reflection inside human skin. The strongest reflection happens at the surface of skin where photon hits the skin tissue from air. This can result in a spectral reduction of the number of photons actually entering into the skin, which results in a reduction in the actual fluorescence signal strength.
Absorption is an intrinsic property of light-matter interaction where the amplitude of electromagnetic field attenuates as propagating. The absorption in a solution can be quatitatively described using the Beer-Lambert law, where the intensity of light decay exponentially as it travels in the absorptive medium. The decay rate is characterized by the absorption coefficient which is a function of the solvend absorpsivity and its concentration. In human skin tissue, the total amount of absorption can be decomposed into several different components, including absorption from water, fat, melanin, and blood content, which can be cast by an empirical equation [REF]:
The scattering process refers to the change in the direction of motion when the photon interacts with the material (mainly the nuclei). In the actual scenario of fluorescence detection, the scattering process can result in two consequences including the attenuation of number of photons in the forward propagating direction, and introducing distortion to the localized signal. The second consequence is the critical factor of reducing the signal to noise ratio, as the localized signal from the dysplasia is smeared by the uncertain scattering processes.
Simulation Congifuration
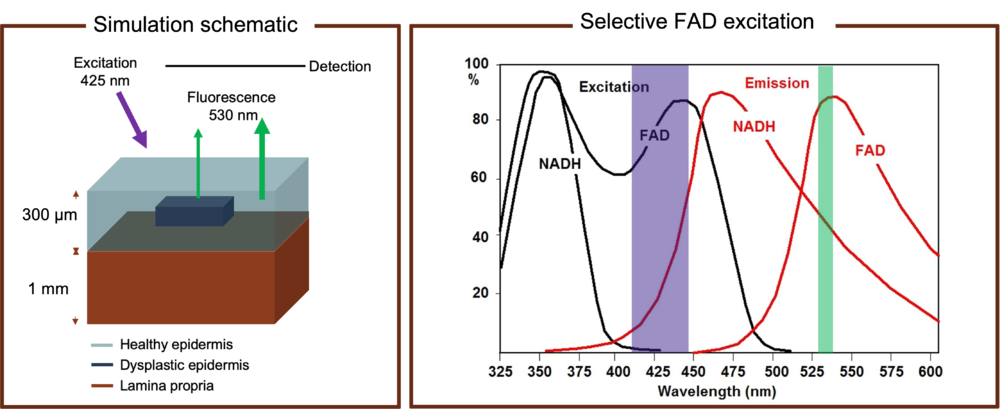
To model the optical behavior, one can extract the physical system into an emission and propagation problem as shown in the figure above. The dysplasia is characterized by a confined region inside the epidermis layer with a reduced FAD concentration. Due to the concentration change the fluorescence emission pattern will change correspondingly, which will result in a difference in signal collected by the external photodetector. The wavelengthes of pump beam and detection are carefully chosen. The pump light wavelength in our simulation is set to 425 nm to maximize FAD absorption while suppress NADH excitation. The detection wavelength is set to 530 nm for the maximum FAD fluorescence signal and reduced signal from other fluorophores as well. The final signal collected can also include the contribution from the collagen mainly in the bottom dermis layer, which can be treated as noise.
Methods
Monte Carlo Simulation
Monte Carlo simulations is a useful tool for modeling and understanding the intricate behaviors of light propagation through tissues. These simulations rely on probabilistic algorithms that simulate numerous random trajectories of photons within a medium, enabling the prediction and analysis of light transport in complex systems. These trajectories are based on scattering events and the optical properties of the medium. As photons travel, they undergo interactions, either scattering off structures within the tissue or getting absorbed. The simulations track the path lengths and angles of these photons, ultimately predicting the reflectance and absorption profiles.
To simulate fluorescence, an initial simulation models the absorption of incident photons by fluorescent molecules like FAD or other fluorophores. The resulting absorption profile is then used as a source for fluorescent light of a different wavelength and the Monte Carlo algorithm is applied again.
MCMatlab
We decided to use MCmatlab based on a class project from last year, where it was implemented to simulate diffuse reflectance of different oxygenation levels for various skin types.
In MCMatlab a medium is defined by specifying a set of parameters. The relevant parameters in our simulation are: Absorption coefficient ‘’, Scattering coefficient ‘’, Emission spectrum ‘’, Quantum yield 'QY', Henyey-Greenstein Scattering anisotropy factor ‘g’ and Refractive Index ‘n’.
All quantities are a function of wavelength. The absorption coefficient is given in units of cm. The scattering coefficient is expressed as the fraction of photons getting scattered while traveling in a medium per unit distance. The emission spectrum describes the relative spectral power emitted for each wavelength. The quantum yield is defined as the number of photons emitted per absorbed photons. Henyey-Greenstein Scattering anisotropy factor has a value between 0 and 1 and quantifies the degree of angular distribution in the scattering of photons within a medium. More concretely, g = 0 signifies purely isotropic scattering, indicating an equal probability of scattering in all directions while g = 1 represents completely forward-peaked scattering, indicating a strong preference for photons to be scattered in the forward direction. See referenced documentation for full details about all parameters.
Relevant parameters for surrounding tissue of varying levels of blood, blood oxygenation, water and fat were extracted from Jacques' work.
Equivalent Model of Fluorophore Solution
When considering the optical response of the epidermis layer for blue light, absorption occurs both directly in FAD as well as in the rest of the tissue. In MCmatlab, a material can only be defined by a single absorption coefficient and emissivity spectrum. This presents a problem since absorption from surrounding tissue artificially contribute to FAD fluorescence in the model. Unfortunately, this yields an unacceptable degree of inaccuracy as the overall absorption by the tissue is large compared to the absorption in FAD, due to its low concentration. In other words, the majority of the fluorescence would come from absorption in tissue which normally does not fluoresce. This also makes it hard to model subtle changes in FAD levels due to the strong artificial fluorescence background.
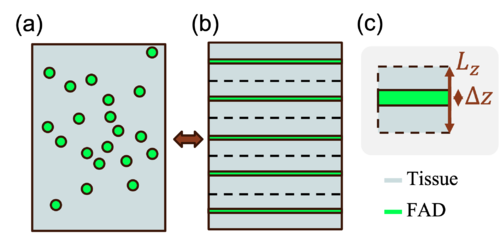
To solve this issue, we introduce a multilayer model where FAD molecules distributed in a volume is collected into thin planes spread across the volume (see Figure 1). By separating FAD from the rest of the tissue components, we can define two separate media in MCmatlab with their respective optical properties, avoiding the issue of artificial fluorescence. However, changing the geometry in this way will also affect the optical response. Below, we derive an expression to correct for the geometrical change.
The total optical absorption can be described as:
Absorption
where is the current density, is the electric field, is the angular frequency of light, is the free space electric permittivity, is the material susceptibility, and is the imaginary part of representing the optical absorption of a certain material. Under the representation of Beer-Lambert law, the electric field penetrating in the skin can be described as an exponential decay: , where is the material absorpsivity in the unit of [cm]. Substituting the exponentially decaying electric field into the absorption expression and applying our one-dimensional multilayer geometry:
Absorption ,
where is the total length in z direction.
For convenience, one can also define the ratiometric absorbance: .
To have the same amount of absorption in the fluorophore when using the multilayer model, we need to equivalently adjust the optical property of the material to balance the effect of shrinking the volume occupied by the fluorophore. Gathering the fluorophore into a thin slab of thickness , the absorbance here is: . Therefore one can increase the absorption coefficient to compensate for the reduced volume. This hold true as long as the field variation across the sub-volume is linear. When , the field decay is approximately linear for a small change in z: for small z. Thus, we can always compensate the change in geometry by choosing a sufficiently small spacing between the thin planes relative to the absorptivity of the material.
Using the equivalent absorpsivity correction, the total absorption is the same. In addition, the blue photon absorbed by FAD will result in the fluorescence emission, such that the correct FAD fluorescence activity can be simulated.
Results
The properties of the dysplastic region directly determines the fluorescence signal. Here, the properties refer to the geometry size, shape, the fluorophore concentration, and the location inside the skin tissue. Below, we will carry out a few computational and numerical experiments to qualitatively describe the dependence between the fluorescence signal strength and these factors. The simulation is conducted based on MCMatlab Fluorescence Monte Carlo simulation package.
Qualitative Dependence on the Dysplastic Width
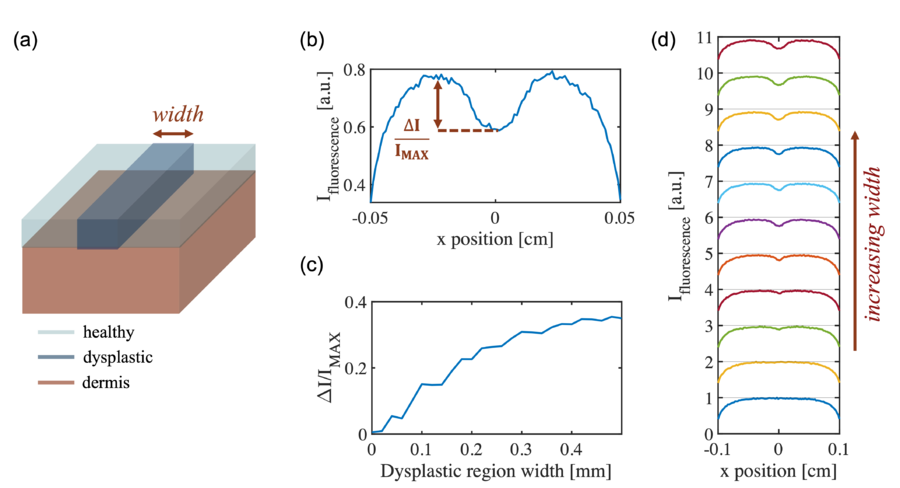
For the first study, the simulated geometry is defined as a one-dimensional concentration variation in "x" as shown in the figure above with a lower FAD concentration at the central region representing the dysplastic region. The width of the dysplastic region is swept and the output fluorescence contrast signal is measured. It is shown that the contrast signal first goes up, then saturates at w~0.35 mm. At small width values, the signals are mixed up from the two edges where the concentration changes sharply, so that one cannot resolve the full contrast signal. When the two edges are separated sufficiently far, the full signal can be resolved, giving a relative fluorescence contrast as 0.3.
Qualitative Dependence on the Dysplastic Depth
Next, the qualitative relation is studied between the depth of the dysplastic region inside the skin and the fluorescence contrast signal. In this case, the geometry is defined as a rectangular wire structure as depicted in the figure below. In the simulation, the width of the rectangular wire is fixed to 0.4 mm and the thickness to 0.1 mm. The depth is set as the swept parameter, and it is defined as the distance between the top surface of the epidermis layer and the top surface of the rectangular wire.
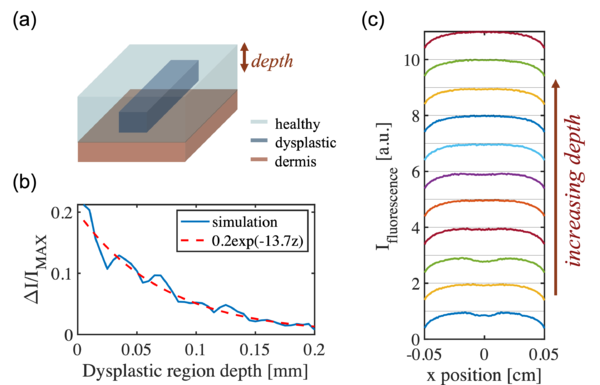
From the simulation, it can be observed that the fluorescence contrast signal decreases as the depth increases, which agrees with intuition. As for a deeper location inside the skin, it takes farther distance for the fluorescent light to travel out, therefore the distortion introduced by the scattering events as the light propagates through the skin tissue is stronger. In addition, the attenuation from both scattering and absorption is stronger as well, which further reduces the SNR. For depth greater than 0.1 mm, the contrast signal strength is nearly vanishing.
Qualitative Dependence on the FAD Concentration Difference
Similarly, the strength of the contrast signal should also be a function of the concentration difference of FAD between the dysplastic and the healthy tissue. The geometry is again defined as a rectangular wire structure as depicted in the figure below. In the simulation, the width of the rectangular wire is fixed to 0.4 mm, the thickness to 0.1 mm, and the depth is set to 0.04 mm. The volumetric concentration of FAD in the healthy region is fixed to 0.2 while the FAD concentration in the dysplastic region is varied from 0 to 0.2.
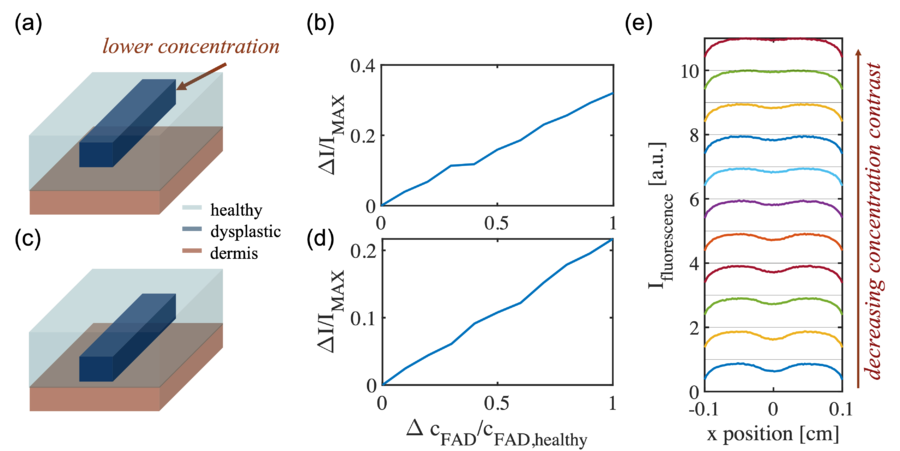
From the simulation, it can be observed that for 0.04 mm as the depth, the fluorescence contrast signal is linearly proportional to the FAD concentration difference, which again agrees with intuition. The concentration difference determines the distribution in the number of fluorescence emitter, which is equivalent to the source and directly proportional to the fluorescence intensity. When increasing the depth of the rectangular wire to 0.1 mm, again the linear dependence is shown however with an overall lower amplitude, representing the decrease in the number of fluorescence emitter.
Image Quality and Simulation Limitations
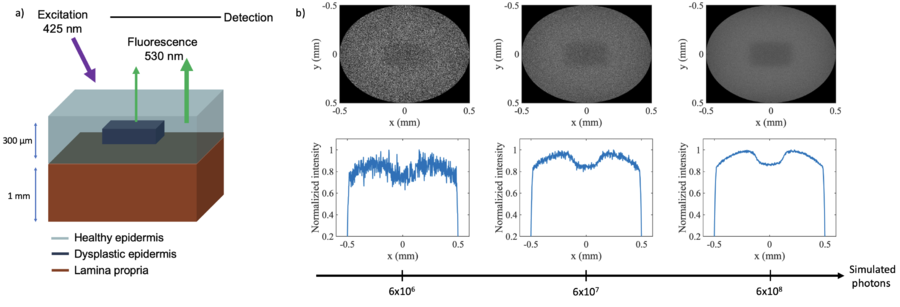
Optical Monte Carlo simulations, while powerful and versatile, are computationally demanding due to the nature of light propagation and the need to model a vast number of photon trajectories. The computational expense arises from the necessity to track individual photon interactions and their probabilistic behavior as they scatter, absorb, and move through the medium. Modeling three-dimensional environments adds complexity, as simulations must account for photon movements in all spatial directions within the medium. To illustrate this, a regular high performance laptop were able to simulate about 10 photons per minute, while a 1mW light source at 400 nm emits 10 photons per second. This can be a problem when trying to model realistic scenarios with low signal to noise. Figure 5 shows a set of images of an embedded dysplastic lesion in healthy tissue, with varying number of simulated photons. The images corresponds to a total simulation time of 4, 40 and 400 minutes, respectively (half to acquire the absorption profile and half for the fluorescence signal).
Conclusions and Outlook
In this project, we explored the usage of the Monte Carlo simulation in fluorescence detection. The MCMatlab simulation package is used for the computational calculation. Using the package, we conducted numerical experiments to study the dependence between the fluorescence signal from oral dysplasia and the properties of the dysplasia region, including the geometries, the material properties, which draws valuable qualitative conclusions for future studies in more depth.
The future directions can be diverse. For example, one could explore on multi-wavelength excitation to simultaneously excite multiple species of fluorescence events. Based on that, one can implement advanced detection scheme to further enhance the SNR. In addition, from medical perspective, the dysplasia will induce changes in the concentration of other fluorophore species as well, which can exhibit correlation with FAD concentration changes, and it can be utilized to boost up the signal strength as well. Finally, the software package can be integrated with the course-related ISET simulation package to incorporate the actual sensor behavior, being even closer to a practical experiment scenario.
Appendix
References
1. Y. Xu et al. Optical Imaging in the Diagnosis of OPMDs Malignant Transformation, Journal of Dental Research 2022, Vol. 101(7) 749–758
2. MCmatlab package and documentation: https://github.com/ankrh/MCmatlab
3. Steven L Jacques Optical properties of biological tissues: a review, 2013 Phys. Med. Biol. 58 R37


