Uploads by CwoodahlS
Jump to navigation
Jump to search
This special page shows all uploaded files.
| Date | Name | Thumbnail | Size | Description | Versions |
|---|---|---|---|---|---|
| 19:36, 13 December 2024 | PostProcessGreen.png (file) |  |
159 KB | 1 | |
| 16:56, 13 December 2024 | GrPix BlVol.png (file) |  |
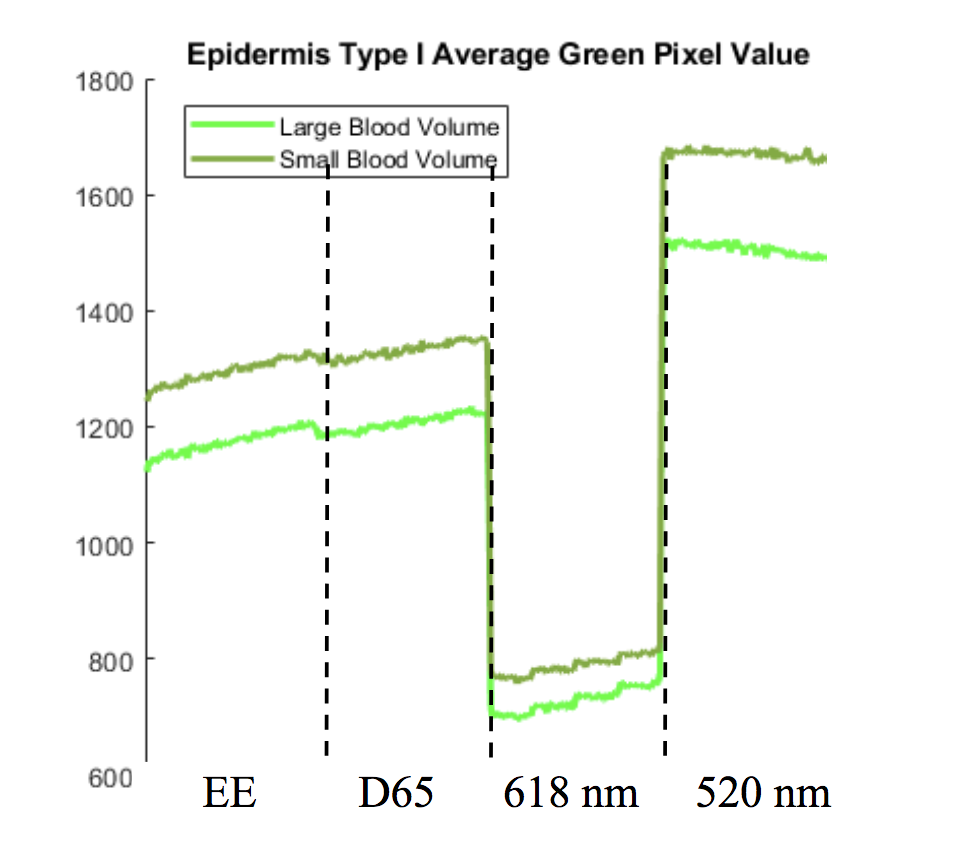
149 KB | Shows the contrast in green pixel data between large and small blood volumes. And increase in pixel value associated with decreased blood volume. | 1 |
| 16:54, 13 December 2024 | BlVol.png (file) |  |
196 KB | a) Reflection spectra for a small volume of blood in type I epidermis. b) Reflection spectra for a large volume of blood in type I epidermis. | 1 |
| 16:52, 13 December 2024 | CYYMAvgPixVal.png (file) |  |
334 KB | a) Cyan, yellow and magenta pixel values for type I epidermis. b) Cyan, yellow and magenta pixel values for type VI epidermis. | 1 |
| 16:50, 13 December 2024 | CYYMQE.png (file) |  |
121 KB | a) Depicts spectral acceptance of each pixel. Color coded to match pixel locations. b) Shows pixel layout with-in one four-block repeated within the filter. | 1 |
| 16:48, 13 December 2024 | RGGBPixVal.png (file) |  |
396 KB | a) Shows the red, green and blue average pixel data for type I epidermis. b.) Shows red, green and blue average pixel values for type VI epidermis. | 1 |
| 16:47, 13 December 2024 | RGGBQE.png (file) |  |
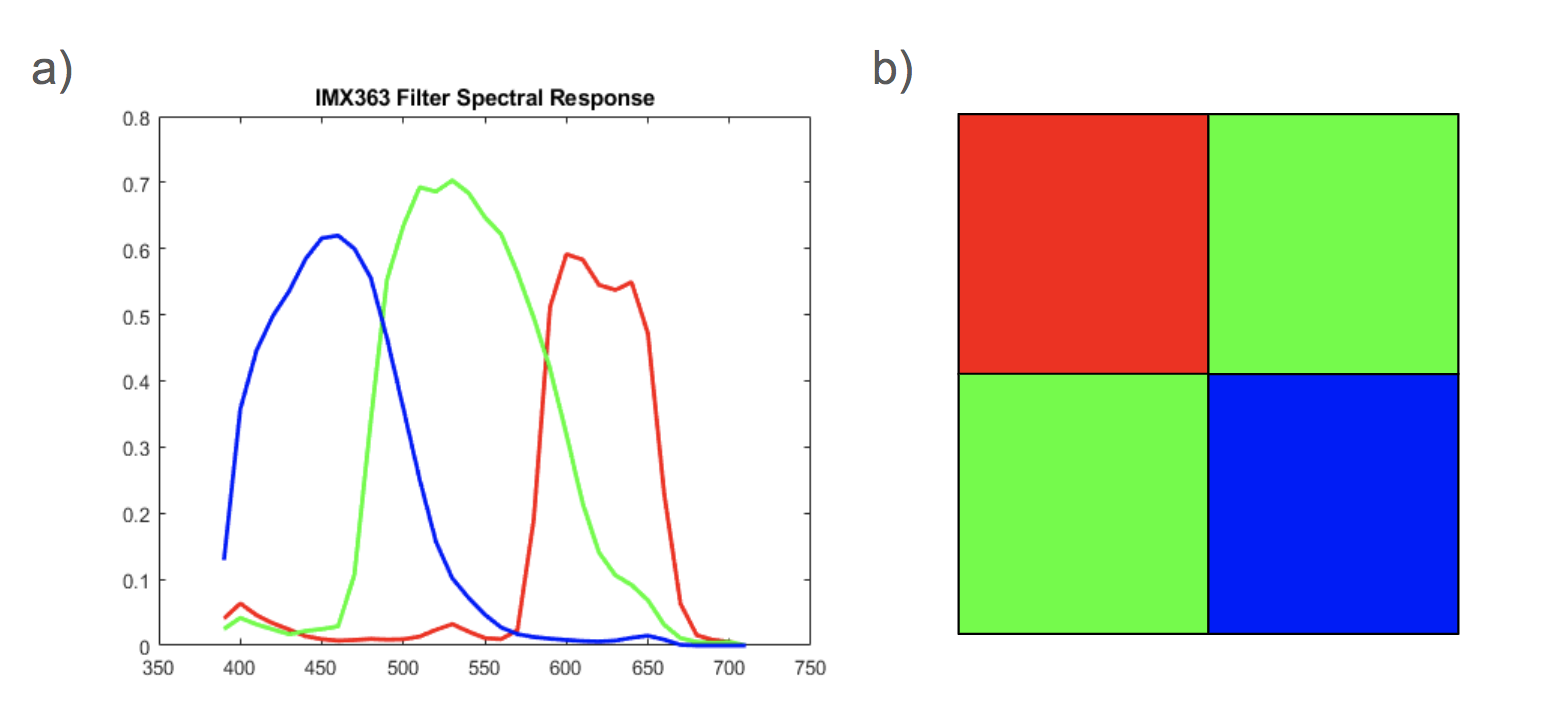
160 KB | a) Shows spectral quantum efficiency of each pixel, curves color to match spectral location of the pixel. b) Filter array layout consisting of repeated block of four with one red pixel, one blue pixel and two green pixel. | 1 |
| 16:44, 13 December 2024 | RCCCPixelData.png (file) |  |
445 KB | a) Shows pixel data for type I epidermis. The red curve is average pixel data for pixels with the red filter, while the black curve is average pixel value for pixels with clear filters. b) Shows pixel data for type VI epidermis with same color coordination. | 1 |
| 16:42, 13 December 2024 | RCCCSpectQE.png (file) |  |
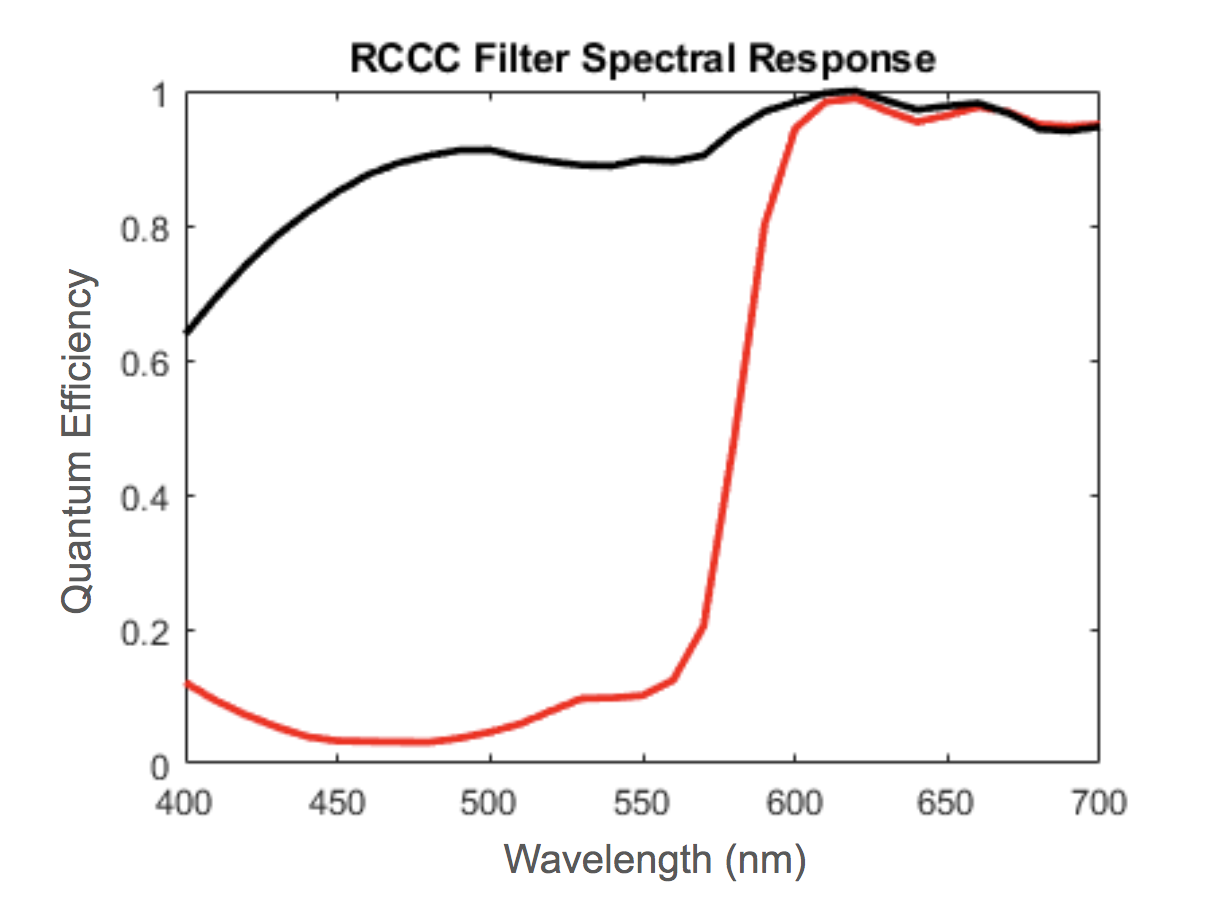
165 KB | Shows the quantum efficiency of the AR0132AT imaging sensor with the RCCC filter. The red curve denotes the quantum efficiency of the red pixels. And the black curve denotes the quantum efficiency of the clear pixel, exhibiting broadband acceptance slightly favoring red wavelengths. | 1 |
| 16:39, 13 December 2024 | MonoAvgPVal.png (file) |  |
259 KB | Shows the average pixel value from the monochrome sensor for type I (blue) and type VI (orange) epidermis. The curves correspond to averages of horizontal slices of pixel data. | 1 |
| 16:38, 13 December 2024 | MonochromProcessImage.png (file) |  |
261 KB | Shows the processed image output from a monochrome sensor, with unitary quantum efficiency at all spectral wavelengths. | 1 |
| 16:33, 13 December 2024 | ReflectionChart4Sources.png (file) |  |
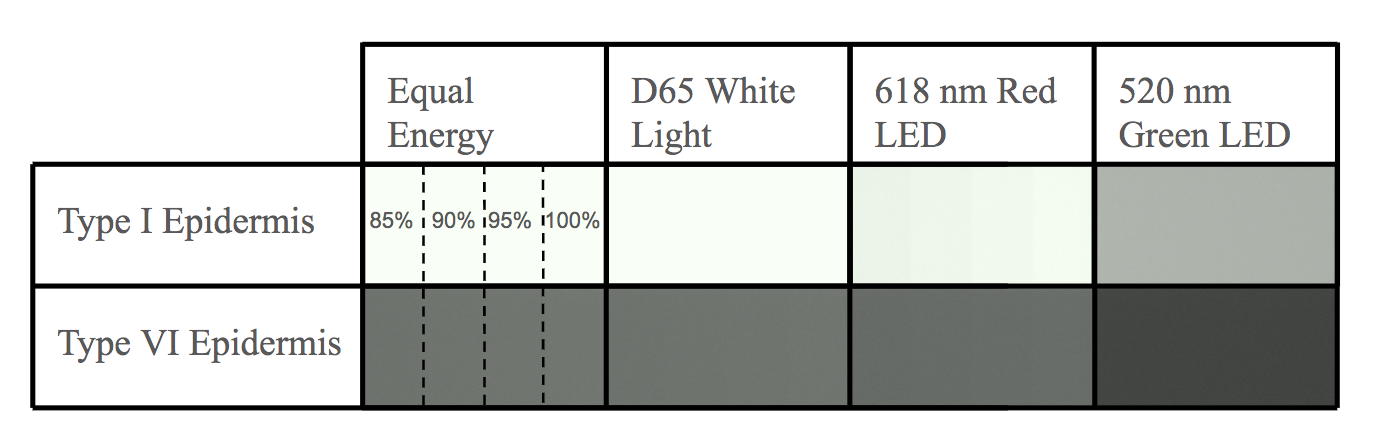
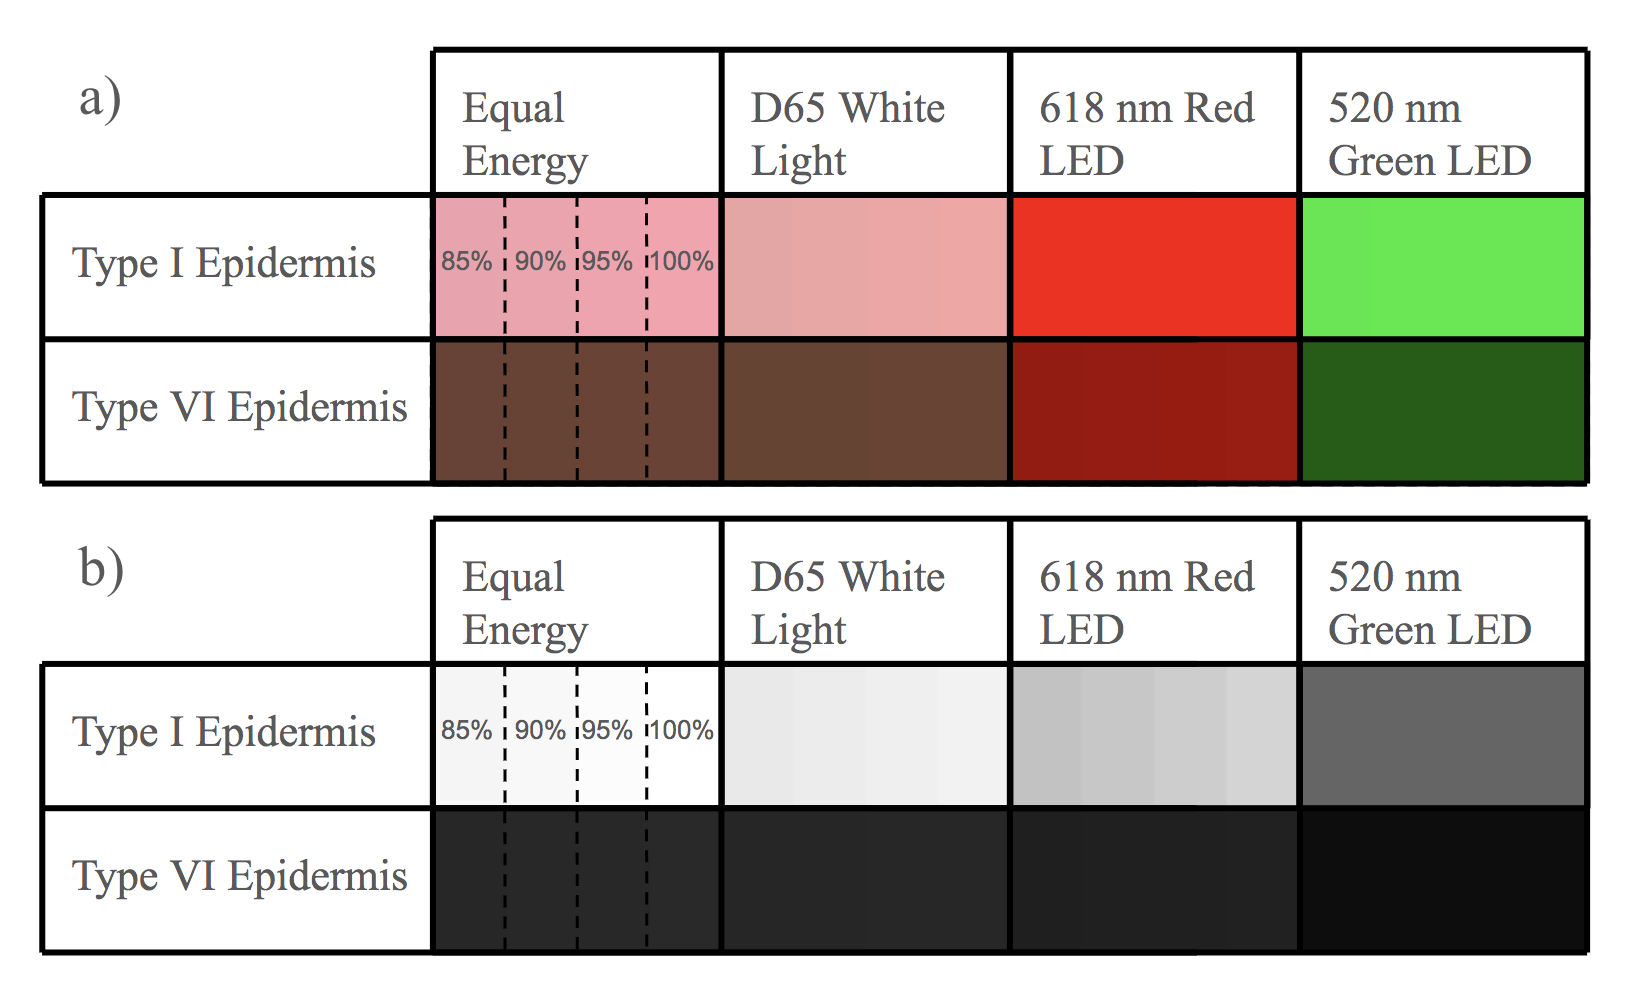
187 KB | a) Shows the reflected light in color for type I and VI epidermises and 4 different illuminants. Columns corresponding to blood oxygen level are shown with dashed lines in the equal energy illuminant, these same column patterns are repeated in each illuminant. b) Gray-scale rendering of a), to visualize contrast in blood levels. | 1 |
| 16:18, 13 December 2024 | TypeI and Type6 Epi Reflections.png (file) |  |
321 KB | a) The reflection spectrum from MCMatlab for a low melanin content, type I epidermis. The reflection values between 600 nm and 700 nm show dependency on blood oxygen content. b) The reflection spectrum of MCMatlab for a high melanin content, type VI epidermis. The greatest dependency to blood oxygen content is observed between 600 nm and 700 nm as well, but less separation is observed. | 1 |