2009 Alina Liberman: Difference between revisions
imported>Psych 204 No edit summary |
imported>Psych 204 |
||
| Line 2: | Line 2: | ||
= Fusiform Face Area Development Throughout Adolescence = | = Fusiform Face Area Development Throughout Adolescence = | ||
The Fusiform Face Area (FFA) is a region in the occipitotemporal cortex that preferentially responds to visual face stimuli compared to place or object stimuli. Golarai et al.(2007) found that the right FFA was significantly smaller in children (ages 7-11) than in adolescents (12-16) or adults (>18). This size difference was not present for the right or left hemisphere face-selective superior temporal sulcus (STS) or | The Fusiform Face Area (FFA) is a region in the occipitotemporal cortex that preferentially responds to visual face stimuli compared to place or object stimuli. Golarai et al.(2007) found that the right FFA was significantly smaller in children (ages 7-11) than in adolescents (12-16) or adults (>18). This size difference was not present for the right or left hemisphere face-selective superior temporal sulcus (STS) or object-selective lateral occipital complex area (LOC). The left hemisphere place-selective parahippocampal place area (PPA) was also significantly smaller in children. These results support a region and category-specific development of high-level visual cortex for faces and places. | ||
An ongoing follow-up study with a new set of subjects and stimuli replicates the right FFA results, except that we find a significantly smaller right FFA in adolescents ages 12-16. This result suggests that cortical development for face processing continues beyond childhood and into adolescence. What may account for this difference in results? In addition to slightly different stimuli, the original study had different analysis methods for their fMRI data. The original study had bigger voxels (3.75mm x 3.75mm vs. 3.125mm x 3.125mm in-plane resolution) and spatially smoothed the data using a 6mm full-width-half-maximum kernel. | An ongoing follow-up study with a new set of subjects and stimuli replicates the right FFA results, except that we find a significantly smaller right FFA in adolescents ages 12-16. This result suggests that cortical development for face processing continues beyond childhood and into adolescence. What may account for this difference in results? In addition to slightly different stimuli, the original study had different analysis methods for their fMRI data. The original study had bigger voxels (3.75mm x 3.75mm vs. 3.125mm x 3.125mm in-plane resolution) and spatially smoothed the data using a 6mm full-width-half-maximum kernel. Scherf et al.(2007) also only found a significant difference in the right FFA in kids but not adolescents, but this study spatially normalized their data into Talairach space. As a result, I wanted to ask the following questions: | ||
<ol> | <ol> | ||
<li> How would | <li> How would the current data, analyzed in native space and without spatial smoothing, change if it was spatially smoothed and normalized? | ||
<li> Would | * Specifically, how would the group-map differ from the individual maps in terms of face-, place-, and object-selective ROI locations, response amplitudes, and sizes? | ||
<li> Would there still be a significant age difference in the size of the right FFA between adolescents and adults? | |||
</ol> | </ol> | ||
Revision as of 04:29, 17 August 2010
Back to Psych 204 Projects 2009
Fusiform Face Area Development Throughout Adolescence
The Fusiform Face Area (FFA) is a region in the occipitotemporal cortex that preferentially responds to visual face stimuli compared to place or object stimuli. Golarai et al.(2007) found that the right FFA was significantly smaller in children (ages 7-11) than in adolescents (12-16) or adults (>18). This size difference was not present for the right or left hemisphere face-selective superior temporal sulcus (STS) or object-selective lateral occipital complex area (LOC). The left hemisphere place-selective parahippocampal place area (PPA) was also significantly smaller in children. These results support a region and category-specific development of high-level visual cortex for faces and places.
An ongoing follow-up study with a new set of subjects and stimuli replicates the right FFA results, except that we find a significantly smaller right FFA in adolescents ages 12-16. This result suggests that cortical development for face processing continues beyond childhood and into adolescence. What may account for this difference in results? In addition to slightly different stimuli, the original study had different analysis methods for their fMRI data. The original study had bigger voxels (3.75mm x 3.75mm vs. 3.125mm x 3.125mm in-plane resolution) and spatially smoothed the data using a 6mm full-width-half-maximum kernel. Scherf et al.(2007) also only found a significant difference in the right FFA in kids but not adolescents, but this study spatially normalized their data into Talairach space. As a result, I wanted to ask the following questions:
- How would the current data, analyzed in native space and without spatial smoothing, change if it was spatially smoothed and normalized?
- Specifically, how would the group-map differ from the individual maps in terms of face-, place-, and object-selective ROI locations, response amplitudes, and sizes?
- Would there still be a significant age difference in the size of the right FFA between adolescents and adults?
Background
-
 Figure 1
 -
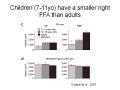 Figure 2
 -
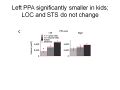 Figure 3


Methods
Measuring object selective cortex
Object-selective cortical maps were obtained in 25 subjects using two localizer scans. The right and left FFA was localized in most of the subjects using an uncorrected threshold of p=.001.

Subjects
Subjects were 14 healthy adolescents and 11 healthy adults .
MR acquisition
Data were obtained on a GE scanner.
MR Analysis
The MR data was analyzed using mrVista software tools.
Pre-processing
All data were slice-time corrected, motion corrected, and repeated scans were averaged together to create a single average scan for each subject. Et cetera.
GLM model fits
Results
Retinotopic models in native space
Some text. Some analysis. Some figures.
Conclusions
Here is where you say what your results mean.
References - Resources and related work
References
Software