2009 Alina Liberman: Difference between revisions
imported>Psych 204 |
imported>Psych 204 |
||
| Line 40: | Line 40: | ||
==== Pre-processing ==== | ==== Pre-processing ==== | ||
Functional data was motion corrected and data were detrended with a temporal high-pass filter. We converted the raw time course into percent signal change by dividing the response ampitude at each TR by the mean amplitude during the blank periods. There was no spatial smoothing or normalizing. | |||
==== GLM | ==== GLM ==== | ||
We ran a GLM with predictors of the stimulus conditions convolved with the SPM2 HRF. For each condition, the BOLD response amplitudes were estimated from the beta coefficients from a GLM applied to the time course. | |||
= Results = | = Results = | ||
Revision as of 05:45, 17 August 2010
Back to Psych 204 Projects 2009
Fusiform Face Area Development
The Fusiform Face Area (FFA) is a region in the occipitotemporal cortex that preferentially responds to visual face stimuli compared to place or object stimuli. Golarai et al.(2007) found that the right FFA was significantly smaller in children (ages 7-11) than in adolescents (12-16) or adults (>18). This size difference was not present for the right or left hemisphere face-selective superior temporal sulcus (STS) or object-selective lateral occipital complex area (LOC). The left hemisphere place-selective parahippocampal place area (PPA) was also significantly smaller in children. These results support a region and category-specific development of high-level visual cortex for faces and places.
An ongoing follow-up study with a new set of subjects and stimuli replicates the right FFA results, except that we find a significantly smaller right FFA in adolescents ages 12-16. This result suggests that cortical development for face processing continues beyond childhood and into adolescence. What may account for this difference in results? In addition to slightly different stimuli, the original study had different analysis methods for their fMRI data. The original study had bigger voxels (3.75mm x 3.75mm vs. 3.125mm x 3.125mm in-plane resolution) and spatially smoothed the data using a 6mm full-width-half-maximum kernel. Scherf et al.(2007) also only found a significant difference in the right FFA in kids but not adolescents, but this study spatially normalized their data into Talairach space.
Research Question
As a result of these somewhat contradictory findings, I wanted to ask the following questions:
- How would the current data, analyzed in native space and without spatial smoothing, change if it was spatially smoothed and normalized?
- Specifically, how would the group-map differ from the individual maps in terms of face-, place-, and object-selective ROI locations, response amplitudes, and sizes?
- Would there still be a significant age difference in the size of the right FFA between adolescents and adults?
Background
The ventral temporal cortex contains different regions that respond preferentially to faces more strongly than objects, objects more strongly than scrambled objects, or places more strongly than objects and faces.
The FFA is located on the fusiform gyrus in the ventral temporal cortex. It was first described as a module for face processing in Kanwisher et al. (1997). Since then, there has been a lot of debate about the properties of the FFA, including whether or not it processes other relevant and well-known objects.

As mentioned above, Golarai et al. (2007) showed that the right FFA (Figure 1 and 2) and left PPA (Figure 3) are significantly smaller in children and that FFA size correlates with face-recognition memory performance on a recognition memory test for faces, abstract sculptures and places. No age difference was found in face-selective STS or object-selective LOC (Figure 3).
-
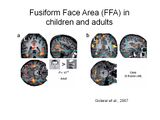 Figure 1
 -
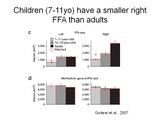 Figure 2
 -
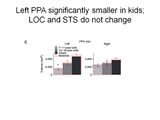 Figure 3


fMRI Methods
Subjects
Subjects were 14 healthy adolescents ages 12-16 (7 females) and 11 healthy adults ages 18-40 (6 females).
MR Acquisition
Data were obtained on a 3 Tesla whole-body GE Signa MRI scanner at the Lucas Center.
Stimuli
Images were projected onto a mirror mounted on the coil. The images consisted of gray-scale photographs of male children and adults, abstract objects, cars, indoor and outdoor scenes, and scrambled images.
MR Analysis
The MR data was analyzed using MATLAB and mrVista software tools.
Pre-processing
Functional data was motion corrected and data were detrended with a temporal high-pass filter. We converted the raw time course into percent signal change by dividing the response ampitude at each TR by the mean amplitude during the blank periods. There was no spatial smoothing or normalizing.
GLM
We ran a GLM with predictors of the stimulus conditions convolved with the SPM2 HRF. For each condition, the BOLD response amplitudes were estimated from the beta coefficients from a GLM applied to the time course.
Results
Retinotopic models in native space
Some text. Some analysis. Some figures.
Conclusions
Here is where you say what your results mean.
References - Resources and related work
References
Software