ChepkwonyChatterjee
LED Flicker system design
Background
Human vision science has been generally defined based on the presence of four types of photopigments in the retina: rods and three types of cones. Rods are responsible for peripheral vision under scotopic and mesopic lighting conditions. Rods are generally not associated with color vision. The cones on the other hand are present in the foveal region and are responsible for color vision under photopic conditions. The L,M,S cones are sensitive to different wavelength ranges of light.
There has been a recent discovery (This paper talks about it) of another type of non-rod non-cone photopigment in the human retina, and this is melanopsin present in the specialized ganglion cells of the retina. Melanopsin in the retina has been studied to the extent that its primary function has been determined to be signaling changes in ambient light levels to the brain throughout the day for unconscious visual reflexes, such as pupillary constriction, and regulating a number of daily behavioral and physiological rhythms, collectively called circadian rhythms. It has been suspected that Melanopsin may play some role in the human visual system as well. The role of melanopsin in color vision and temporally varying light intensity patterns is an emerging research area.
To understand the role of Melanopsin in the human visual system, researchers need a setup for conducting psychophysical experiments. The goal of our project was to build such a device which makes it easy to carry out such experiments.
High Level Device Specifications
- Should be capable of producing 4 or more primary colors.
- To test the theory that four color sensitive photopigments (L,M,S cones and melanopsin) contribute to color vision
- The flicker rate of each primary color should be programmable.
- To test the response of varying temporal frequencies of light flicker.
- The light intensity levels should be adjustable
- To allow for variation of lighting conditions to stimulate the photopigments to different levels.
- Should be an easy to use compact portable design.
- The ideal design would be that of a black box with commands for input and a optical fiber which brings the light output. The hope is to integrate this device into an fMRI testing environment.
Design
Components
- LED Array of primary lights
- For our final design (to be implemented in future): 7-in-1 round assembly LED Array
- Polymer Optics 7 LED Cell Cluster Concentrator lens arrangement
- Shown in this page Lens Optics
- Arduino Mega 2560 microcontroller Arduino website
- A simple heat sink like Heat sink picture
- A perforated circuit board (for the final design) and a breadboard (for making a prototype)
- Circuit components
Circuit

To get a system that produces a stable light output, the LED must be driven by a constant current. An approach to get a constant current is using the circuit to the right. The way this circuit works is that the Rfeedback resistor and BJT combination sense the amount of current flowing though the LED and feed this signal back to the MOSFET gate controlling its voltage and hence the current flowing through it.
The key parameter that must be selected with caution is the Rfeedback resistance since that controls the maximum amount of current flowing through the circuit. This page mentions that an empirical estimate to the maximum current flowing through the circuit is 0.5/Rfeedback. We performed some circuit simulations in SPICE to get a sense of the appropriate parameter values.
Seven copies of this circuit should be made to drive each LED, with the seven PWM output signals coming out from different channels of the Arduino microcontroller.
Method
Simulations
We performed simulations of the circuit in HSPICE, to understand the appropriate values of resistances required for the design and also to check the temporal characteristics in the ideal case.
Setting the Rfeedback value as 2 Ohm, we got the current flowing through the LED as 375mA which is well within the capacity for the Luxeon LEDs. For the prototype circuit that we built using regular LEDs, we used around a 30 Ohm resistance for the feedback to limit the current to below 100mA. Code included in Appendix 1.
- Simulation waveforms
-
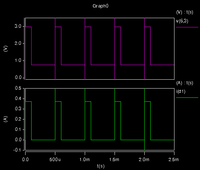 Current and voltage waveforms
Rfeedback = 2 Ohm -
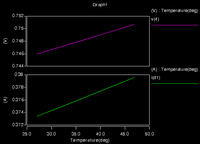 Effect of temperature sweep on current


Prototype Circuit
As a prototype for the final circuit, we designed the system on a breadboard. The circuits for each of the seven channels feeding the individual LEDs were small and compact. We modified the existing firmware to parametrize the number of output channels. Once the circuit was ready we connected it to the arduino and gave commmands to the Arduino through the USB port serial interface.

Results
Circuit Measurements
We performed tests to measure and verify various aspects of our design. We wanted to verify that our circuit design did match the simulation, therefore part of the tests done were to verify the voltage and current. We also did tests to verify the stability of the output from the circuit over time. Finally we analyzed the spectral characteristics of the light emitted from the LEDs.
Circuit voltage and current measurements
We took voltage measurement across the LED and measured the current being drawn from our power supply, which in this case was the Arduino. The results showed that we had a 1.1V drop across the LED and that the total current being drawn from our power supply was approximately 90mA.
We also measured the voltage that was generated from a solar cell that was placed directly over one of the LED's. The voltage measure across the solar cell was 0.2V.
Note the PWM input from the Arduino was a square wave running at 2Khz and was modulated by a sinusoidal was that was at a 3Hz freq. See video in slide 12 for a better picture into input.
Circuit temporal measurements
The LED Flicker device was left to run for 1 hour after the initial measurements were taken. We then remeasured the voltages and currents. The goal of this test was to verify the stability of the circuit.
After 1 hour the voltage drop across the LED was 1.1V and the maximum current drawn by the circuit was 90mA. The measured voltage across the solar cell was still 0.2V. This results did show that the circuit was stable after a 1 hour period.
LED Measurements
We obtained the LED spectral properties using a spectrophotometer. We got measurements for all the seven LED's that we were using. The graph below shows the spectral power distribution on the LED's. The second graph is the normalized version of the first graph. As you can see from the SPD curves the bandwidth of most of the LED's was narrow, apart from the white LED. Also the intesity of the blue and red LED seemed to be the greatest as shown by their SPD curves. We were expecteing to get high intensities and narrow bandwidths with the shorter wavelength LED's and lower intensities and wider bandwidths with the larger wavegth LED's. Our results did not show this and we attribute this mainly to the fact that we were not using the Luminex 7 pack LED module that we had planned to use. This module has well matched LED's that will give SPD's that would be similar to what we expected. Also another fact is that our resistance values were not matched well with our LED's and this can be attributed to the fact that we did not have the right circuit models for the LED's to do a simulation and get the right resistance values.
- Spectral power distribution
-
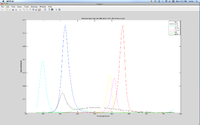 Spectral Power Distribution
 -
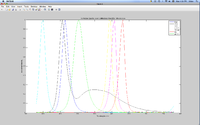 Normalized Spectral Power Distribution


The last set of spectral measurements we performed on the LED's was to capture the maximum intensity as we decreased the mean input voltage/power to the LED. We obtained a linear curve for all the LED's apart from one as shown in the curves below. We believe the curve that was not linear was as a result of that specific LED getting to it's saturation point before the peak power that was being provided.

Conclusions
References
Software
Appendix I - Code and Data
Code
Spice code for simulated circuit: File:Circuit.sp.zip
Arduino code for driving LED circuit: File:LEDFlicker Code.zip
Data
Appendix II - Work partition
Hardware assembly - Tirthankar Chatterjee
Firmware edits - Isaac Chepkwony
Simulations and Testing - joint