PetykiewiczBuckley
Introduction

Haze is caused by the scattering of Rayleigh and Mie light by particles in the atmosphere, such as droplets of water or smoke. These particles, which are between the viewer and a distant object, scatter light from other areas toward the viewer (airlight), and prevent some of the light from the distant object from reaching the viewer (see schematic). Restoring an image to non-hazy conditions is desirable because we like clear days. Since the amount of Rayleigh scattering increases proportional to , where is the wavelength of light, for longer wavelengths there will be less scattering, and thus the image will appear less hazy at these wavelengths. Here, we investigate using NIR and red spectral data to add detail and thus dehaze images, using a modified version of the algorithm described in [1]. Our study differs from the investigation in [1] as we do additional spectral characterization, made possible by the hyperspectral data made available to us. This algorithm takes detail from the long wavelength channel and adds it to a visible luminance channel to dehaze the image. Our investigation includes data from 400-1000 nm (as this spectral range is technically accessible with a silicon detector), and we investigate the best design for a NIR filter for dehazing, and the possibility of using the red camera sensor from three different commercial cameras to dehaze all three color channels. We perform a viewer study to assess the effectiveness of our dehazing. We also explain our results using spectral data and comparing to an online database[2] of reflectance spectra. We also dehaze RGB images taken from the dataset from [1] available here compare dehazing of these images with NIR data (also available in the dataset) and with the R pixel values, obtaining (to us) more attractive results with the R camera sensor.
Methods
We started with the hyperspectral panorama taken from the dish. Initially, we converted (scenes from) this data to the CIEXYZ space by interpolating the XYZ curves from ISET at the wavelengths at which the hyperspectral data was taken, and using these curves to weight the spectral data (see attached code). To view the image, we then converted the XYZ data to sRGB and used the Matlab image processing toolbox to display it. We later used sensor spectral responses (from the lecture notes, Nikon, QImaging and Kodak) to convert to RGB. The dehazing was done using the L* channel in CIELAB space (although we also investigated using a linear luminance channel).
Dehazing Algorithm
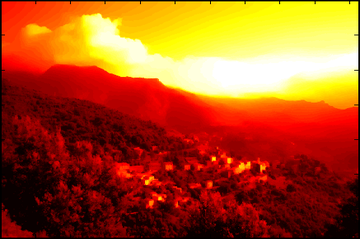
To dehaze the image, we used as a starting point the algorithm described in reference [1], operating on the L* channel of the CIELAB representation of both the visible and NIR data. This algorithm uses an edge preserving weighted least squares transform (described in [3]) to decompose the image into an over-complete multiscale representation consisting of a series of approximation and normalized detail images of different degrees. The detail images formed from the NIR and visible intensity images are then compared pixel-wise and combined to form a composite image containing features from both the NIR and visible data. The approximation images are given by:
where is the kth level approximation image (which can either be visible, or NIR, ), and where refers to the weighted least-squares approximation of the intensity map (described in [2]), with specifying the coarseness of features in the approximation. Matlab code implementing the function W is freely available here. specifies the minimum coarseness used (and thus the finest detail level used for dehazing), c specifies the difference in detail between successive approximations, and k is iterated from 1 to n. As in [1] we chose , c = 2 and n = 6, although we experimented with different values and obtained similar results. is either an intensity channel of the visible image or the NIR image . We compared both a linear intensity channel and nonlinear (L*) channel for the dehazing, obtaining similar results. The NIR intensity image was also converted to an L* nonlinear scale before applying the filter in the case that the L* visible image channel was used.
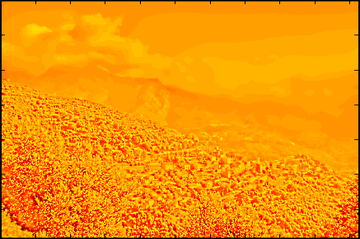
The detail images are differences of approximation images, as described in [1],[4], and are given by
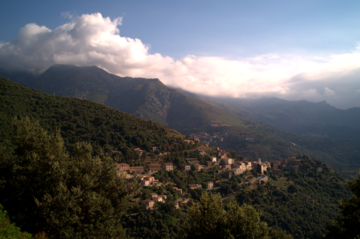
An example of original, approximation and detail images is shown below.
|
|
|
| The original color image | An example intensity approximation image | An example intensity detail image |
The synthesis procedure is based on the observation that
and that the NIR image has higher contrast when there is haze, and therefore we can take from the detail image whichever has a higher intensity to create the fused image
NIR data choice
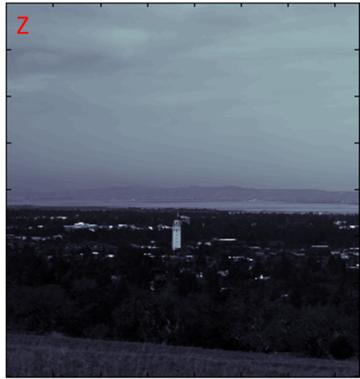
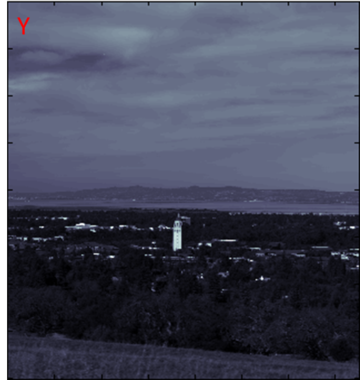
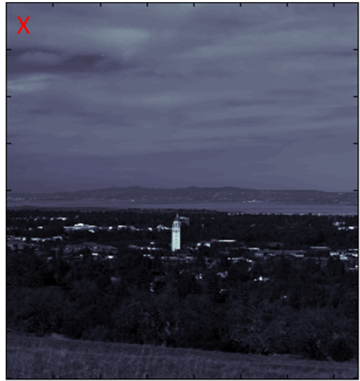
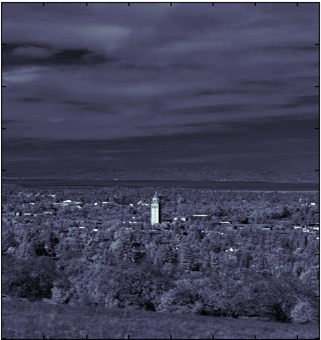
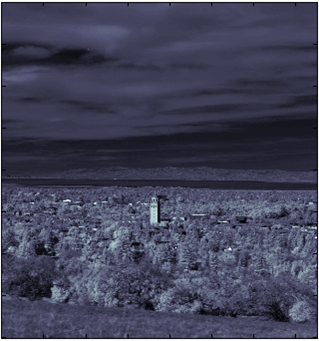
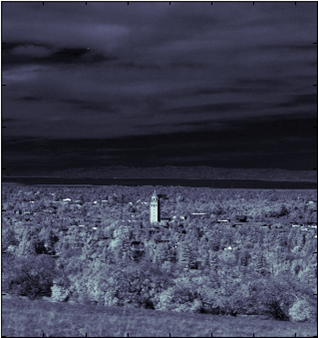
In practice, we found that simply replacing the visible detail with the NIR detail was not much different from this. Our first attempts at dehazing, using bands in the NIR (850 nm) resulted in a dehazed sky but "snowy" mountains (see results section). After attempting to modify the algorithm to fix this, we looked more closely at the spectral data to explain this result. Simply looking at the intensity images in different spectral bands it is clear that the images change as you move from the visible to the NIR. The images almost seem to invert.
|
|
|
| Z channel intensity | Y channel intensity | X channel intensity |
|
|
|
| 700-775 nm intensity | 775-850 nm intensity | 850-920 nm intensity |

Taking the intensity image at different wavelength bands in the hyperspectral data and summing in the x direction yielded the plot of intensity versus image y-height versus wavelength shown at left. The horizon is clearly visible, and the image intensities seem almost to invert at around 700 nm. Plotting spectra by this method for different areas of the image we were able to discern that the problem was perhaps resulting from different reflectances in the visible and NIR. In addition, atmospheric absorption lines are notable in the data.
Consulting an online database [2] (see figure), it became apparent that this is a result in the huge jump in reflectance for vegetation at around 700 nm. At longer (NIR) wavelengths, vegetation is highly reflective, and at certain wavelengths there will be no contrast at all between soil and trees for example. This means that at these wavelengths even if you can see through haze, there will be no contrast (details) to add!
We modified this algorithm to use as the NIR data for dehazing (1) wavelength bands of hyperspectral data, from 574 nm to 974 nm (attached in appendix I), (shorter than that made the image more hazy) (2) Gaussian bands of hyperspectral data in the same range (3) Use input red camera sensor filter spectrum to both "read" (as opposed to the CIEXYZ curves we initially used) the hyperspectral data and dehaze it. We also examined the hyperspectral data for spectral characteristics that would help us to determine the best wavelength range to use, and why specific wavelength ranges worked better than others. Once we had determined that we could use the red camera sensor to dehaze images, we downloaded [ images] (available online) used in the paper [1] and dehazed them using both the R camera sensor and the NIR data to compare these. Results are discussed in that section.
 |
 |
 |
Viewer Study
We performed a viewer study on five people, in which we displayed side by side images that we had dehazed and original images, and asked which they thought was better (or if they couldn't tell them apart). Images included were (i) dehazed with 700 nm (2 nm spectral band), without and (ii) with Photoshop white balancing, dehazed with 775 nm (10 nm spectral band), (iii) dehazed with QImaging red sensor , without and (iv) with Photoshop whiteness balancing, (vi) a panorama dehazed with the same 700 nm spectral band and (vii) a panorama dehazed with the QImaging red sensor.
Results
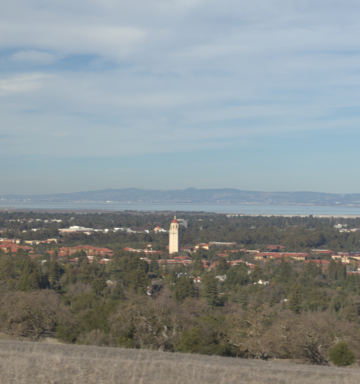
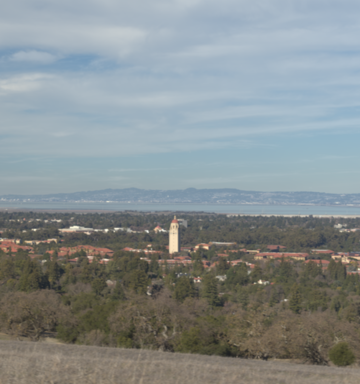
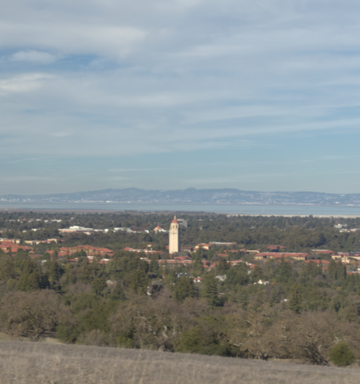
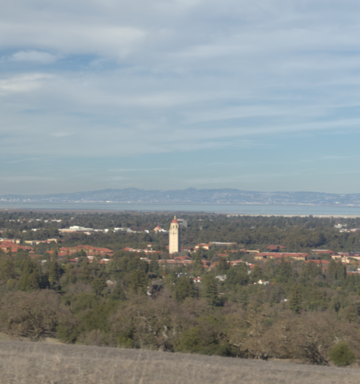
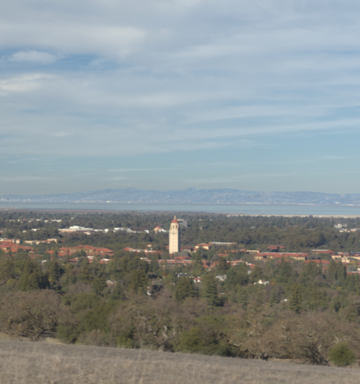
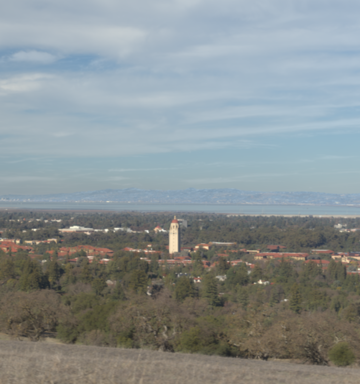
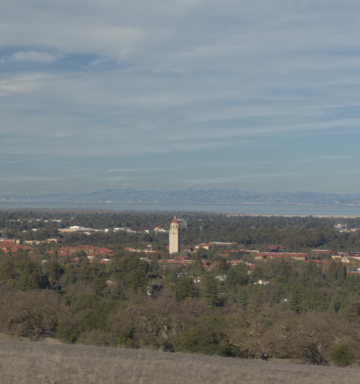
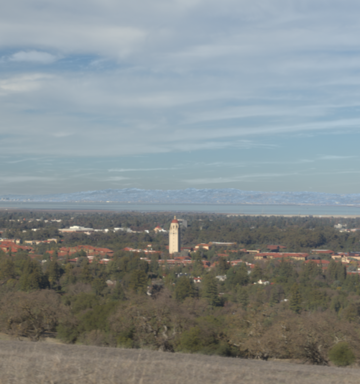
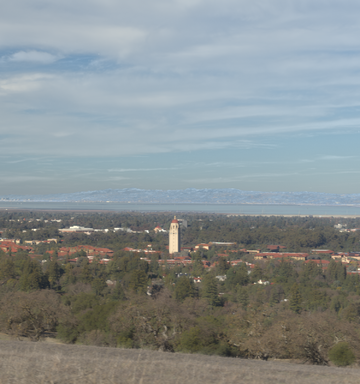
The degradation in mountain-sky edge contrast and loss of visible details in dehazed mountain regions begins around 700 nm and worsens at longer wavelengths, matching the rapid increase in vegetation reflectivity at those wavelengths and corresponding to a loss of contrast between vegetation and granite reflectivities.
|
|
|
| Original | Dehazed with 684 nm | Dehazed with 694 nm |
|
|
|
| Dehazed with 704 nm | Dehazed with 714 nm | Dehazed with 734 nm |
|
|
|
| Dehazed with 775 nm | Dehazed with 854 nm | Dehazed with 914 nm |
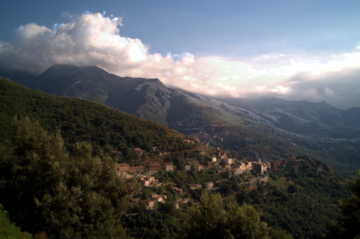
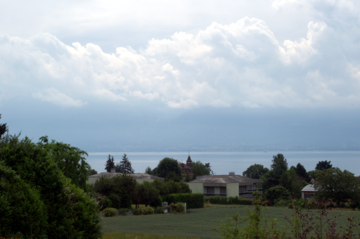
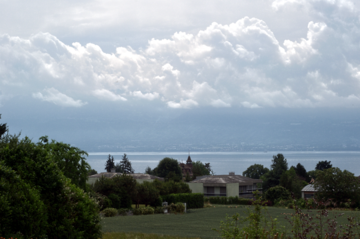
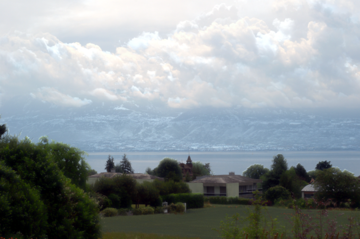
Images taken from dataset and visible image was converted from sRGB to CIELAB for dehazing. The red dehazed image was dehazed with X-.192Z to eliminate part of X that extends into the blue. While some more detail can be seen in the NIR dehazed image compared to red dehazed image, examination of the images show that the mountains and trees in the background have become far bluer and even white in the bottom image.

|

|
|
| Original | Dehazed with X-.194*Z | Dehazed with IR |
|
|
|
The results of the viewer study (described in methods).

Summary and Conclusions
- Implemented dehazing algorithm from Schaul et al.
- Dehazed images using different spectral bands
- Connected results with material spectral reflectivities
- Red camera sensor can dehaze images!
- Performed viewer study with mostly promising results, although we'd really have to do it more carefully and ask more people to get a better idea.
Future Work
- Since the best dehazing (in our opinion) was by the long wavelengths right at the end of the visible range (and right before the jump in reflectivity of vegetation), having a sensor with a sharp spectral function would help improve the dehazing. If this could be done effectively using a linear combination of RGB data to extrapolate intensities in a narrow-band at an optimal wavelength, the dehazing by this method could be improved. We touched on this when we used X-(0.194)Z to dehaze the dataset images.
- The work by He et al. on dehazing using a dark channel prior [6] seems very promising. They essentially use the different transmission through haze of the different color channels to estimate the transmission of the haze and remove it. It is possible that the NIR data would improve their model, although the problem of decreased contrast would likely again cause problems. The colors seem much better preserved by this algorithm seem than with the algorithm used by Schaul et al. [1] and us! It would certainly be interesting to investigate this further.
- Create a metric for dehazing quality, eg. comparing to same pictures taken on a clear day, or using polarization data and algorithm from Schechner et al [5] (this takes advantage of the fact that airlight is partially polarized).
References
- L. Schaul, C. Fredembach, and S. Süsstrunk, Color Image Dehazing using the Near-Infrared, IEEE International Conference on Image Processing, 2009.
- Baldridge, A. M., S.J. Hook, C.I. Grove and G. Rivera, 2009.. The ASTER Spectral Library Version 2.0. Remote Sensing of Environment, vol 113, pp. 711-715
- Z. Farbman, R. Fattal, D. Lischinski, and R. Szeliski, “Edgepreserving decompositions for multi-scale tone and detail manipulation,” International Conference on Computer Graphics and Interactive Techniques, pp. 1–10, 2008.
- A. Toet, “Hierarchical image fusion,” Machine Vision and Applications, vol. 3, no. 1, pp. 1–11, 1990.
- Y.Y. Schechner, S.G. Narasimhan, and S.K. Nayar, “Instant dehazing of images using polarization,” IEEE Conference on Computer Vision and Pattern Recognition, vol. 1, pp. 325–332, 2001.
- K. He, J. Sun, and X. Tang, “Single image haze removal using dark channel prior,” IEEE Conference on Computer Vision and Pattern Recognition, pp. 1957–1963, 2009.
- C. Fredembach and S. S¨usstrunk, “Colouring the near infrared,” IS&T 16th Color Imaging Conference, pp. 176–182, 2008.
Appendix I
- Viewer Study of Dehazing - The slideshow we showed in our viewer study
- Hoover tower dehazed with Gaussian standard deviation 10 nm, center wavelength from 574 nm to 974 nm-zip file, ~100 MB
- Matlab implementation of the dehazing algorithm - Includes code for dehazing single images using the red channel, and code for viewing and dehazing hyperspectral data with arbitrary filter definitions. Depends on weighted least-squares coarsening transform from [3], freely available for Matlab here. Also depends on hyspex read-in functions and colorspace transformations from the ISET package (not included).
Appendix II
- Jan and Sonia split the work exactly down the center.


