Sahar Nassirpour
fMRI meets DTI
This project uses visual cortical activations measured by fMRI to define visual areas and maps them through the white matter of the brain using white matter tracts suggested by a DTI tractography algorithm.
Background
It has been known for a long time now that most of the posterior of human brain respond to visual stimuli. The visual cortex includes the whole occipital lobe and also extends into parietal and temporal lobes. More than a century ago, through lesion studies, neurologists realized a correlation between the location of the lesion in the visual cortex and certain deficits and blind spots. By studying this correlation, they defined the primary visual area in the visual cortex (V1), which covers one hemifield in each hemisphere, and responds to visual stimuli in both foveal and peripheral places. Subsequent studies uncovered multiple other maps, for example another area called V2 surrounding V1, etc. Some of these areas are very well-known and everyone agrees on their existence, but the exact size and location of some them are still in discussion. The act of using fMRI measurements of visual cortical activations and our knowledge of the visual maps to define ROIs on the brain is called "Retinotopy".
Also, it is known that there is an architecture connecting these areas: we know that signals travel back and forth between this areas. The most famous map of this hierarchy is the one provided by Felleman and Van Essen,1991; Van Essen and Maunsell, 1983 through a monkey study. The only non-invasive way to see if the fibers in the white matter of the brain support this architecture in human brain is through the existing tractography algorithms that use DWI (Diffusion Weighted Imaging) and DTI (Diffusion Tensor Imaging) to tract fibers and fascicles in human brain. DWI and DTI scans measure how easily water molecules can diffuse in one direction versus another in the white matter of the brain and use the data to estimate the pathways between different points of the brain. The main goal of this project is to first use fMRI data to perform a retinotopy on the brain and define some of the well-known areas on the brain, and then use a group of fibers estimated by a deterministic tractography algorithm and associate statistics to them to create a platform and visualization method that would later enable us to study the architecture behind the visual areas of the brain.

Methods
Subjects
The subject for the retinotopy part of the project is different from the one used in the second part. I had to change subject for the second part because the DTI data for the first subject was not available. But, the retinotpy on the second subject has been done similarly to the first subject.
MR acquisition
For performing a retinotopy one needs two kinds of experiments, here are the details of these experiments:
1- Polar Angle Experiment: Blocks of traveling checkerboard wedges Each Block= 8s, Total time of run: 104 s , TR=2s Each Block has 4 stimulus type :up,right,down,left 2 runs / 10 Total Blank blocks
2-Eccentricity Experiment: Blocks of expanding checkerboard rings Each Block= 8s, Total time of run: 104 s , TR=2s Each Block has 4 stimulus type :up,right,down,left 2 runs / 10 Total Blank blocks
The fibers used in the second part of the projects are imported from a deterministic tractography algorithm. The fiber group includes 15,203 fibers and they are all the fibers estimated by the algorithm that are either entering or exiting the occipital lobe of the right hemisphere. Here is what the fibers looked like before any processing were done on them:

MR Analysis
The MR data was motion corrected and the time series of the two runs of each experiment were averaged. The traveling wave analysis was done in MrVista and the ROIs were defined on the inflated surface mesh, using the eccentricity and the polar angle maps and the information and criteria provided in B.Wandell et al. Neuron review paper,2007. For defining LO areas, the MT area was used as a landmark, it was obtained by computing a contrast map on a standard MT localizer scan. The coherence threshold was set to around 0.17. The fibers were imported into QUENCH (a fiber visualizing and editing software written at Stanford by Anthony Sherbondy and Shireesh Agrawal), the eccentricity and polar angle maps along with the ROIs were imported into QUENCH using codes written in MATLAB. Statistics were assigned to the fibers using MATLAB and the fibers were grouped and colored based on this statistics in QUENCH.
Results
Retinotopy Results
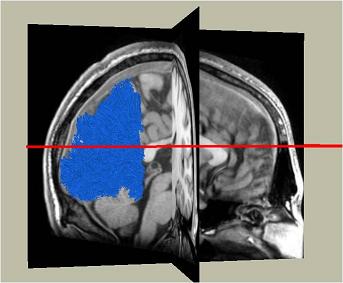
Here are the ROIs on both hemispheres resulted from performing retinotopy on the subject:


Here is the mean time series, the fft of the mean time series, and the coverage map for the V1 area in the right hemisphere that can be used as a verification of the results.

Fiber grouping Results
You can make different visualizations in QUENCH with the available MATLAB codes. Here are some examples: Here is a series of screenshots of the ROIs imported in QUENCH, that can provide a good 3D visualization of the position of the ROIs in the visual cortex:


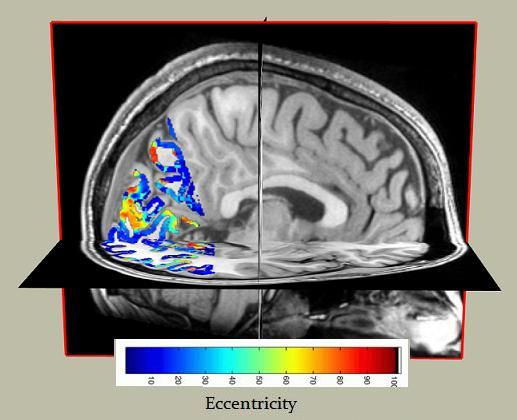
Here is a screenshot of the eccentricity map imported in QUENCH from MrVista:

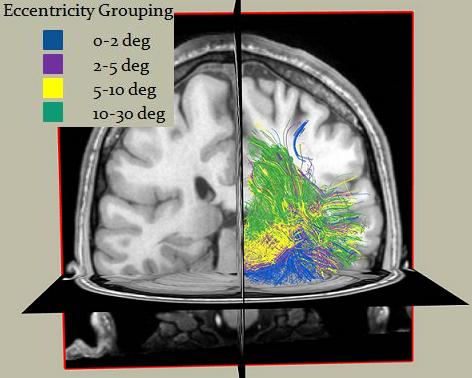
Here is a screenshot of the fibers grouped based on their eccentricity values:

Here is a series of screenshots showing the endpoints of the fibers grouped and colored based on their eccentricity values as we travel from back of the occipital lobe to the front in the right hemisphere:

Here is a screenshot of the fibers passing V1 and V2 areas of the brain:


Conclusions
This project provides a mean for exporting different retinotopic maps as well as ROIs from MrVista and a platform for visualizing this areas. Also, you can import fibers from a tractography algorithm and assign statistics to them and group them based on these maps and show them with the maps on an anatomical image. This way we can create some interesting visualizations as the ones provided above. You can see some interesting results in some of the visualizations: For example: In the movie showing the endpoints of the fibers grouped and colored based on their eccentricity values you can see how a cluster of eccentricity mapping fibers are forming and heading toward out of the occipital lobe. Or in the following screenshot showing only the foveal and peripheral mapping fibers, you can see that the down going stream tends to be more foveal, and the up going stream seems to be more peripheral. When one considers the theory of ventral and dorsal stream in the brain which says that the ventral stream carries information to places responsible for object recognition and the dorsal stream carries information to places responsible for spatial orientation recognition, this can be an interesting result.


References
[1] B. A. Wandell, S.O. Dumoulin and A. A. Brewer , "Visual Field Maps in Human Cortex", Neuron, V. 56 , p. 366-383, 2007