Streaming And Augmenting Stereo Camera Images - Visual Field Estimation using Oculus
Jayanth Ramesh and Pulkit Agrawal
Introduction
Problem Statement
Our objective for the project was to estimate the visual field of patients suffereing from various kinds of visual complications resulting from macular degeneration, retinitis pigmentosa, glaucoma, hypovolemia, hallucinogenic drugs, merucry poisoning, altitude sickness and other such causes in a efficient manner. We propose two algorithms for estimating the visual speed. One algorithm involves scanning the visual field first using a circular stimulus, followed by moving a point stimulus in a linear fashion. The second algorithm is a fast way to estimate the visual field, though the method is less accurate compared to the first algorithm. We call the first algorithm as Circular Linear Scan algorithm and the second algorithm as Mouse Tracking algorithm.
Motivation
Current Perimetry tests can take upto 23 minutes per eye for visual field estimation. This can become very tiring for the patient. Moreover, the tests are passive in the sense that they don't involve an active participation from the patient. In current tests, the visual field is scanned by flashing a light at different points in the field. The question was whether it is possible to reduce the time it takes to perform perimetry tests, so that it doesn't weigh heavily on the patients and can it be more interactive, in the sense that it involves an active participation from the patient?
Perimetry Tests
There are four major kind of perimetry tests.[1]
Tangent Screen
The vision is tested by presenting different sized pins attached to a black wand which can be moved against a black background. The stimulus here (the pins) can be white or coloured.

Goldmann Perimeter
Goldmann perimeter is a popular method for performing perimetry tests. In this test, a hollow spherical white bowl is positioned at a set distance from the patient. The simulus, which is bright light, is moved from beyond the edge of the visual field into the visual field. Goldmann perimeter can test the entire range of peripheral vision. The brightness and intensity of the test light can be varied. The test is administered by an examiner. It has been used for a long time for detecting vision changes in Glaucoma patients which has been replaced by automated perimetry test in recent times.

Automated Perimetry
In automated perimetry, a mobile stimulus is moved by a perimetry machine. The machine flashes light at different points in the field and the patient indicates if the light is visible or not by pressing a button. The chin of the patient rests on the machine and the eye not being tested is covered. The patient is asked to fixate on a point at the center. Depending on the response of the patient, the computer automatically maps and calculates the patient's visual field. Automated Perimetry is the most commonly used form of perimetry for estimating visual field these days.
Microperimeter
It is a fine detail mapping technique that compensates for eye movement while fixating during the test. This is also a type of automated perimetry as the visual field is determined in a computerized fashion.
Stimulus Presentation
There are two popular methods of stimulus presentation, which can be categorized as static perimetry and kinetic. [2]
Static Perimetry
In this test, different locations of the field are tested by gradually increasing the brightness of light at each location until it becomes visible. This method is then repeated for several locations until entire visual field is mapped.
Kinetic Perimetry
Here, instead of presenting light of varying intensity at a given location, a stimulus of fixed intensity and size is moved across different locations in the field. This test is then repeated for lights of different intensity to get the overall visual field estimate.
Types of Visual Field Defect
Before moving on to describing our proposed algorithms for perimetry tests, we describe the different kinds of visual field defects that could be possible in a patient suffering from Macular Degeneration or Glaucoma. The types of defects can be grouped under one of the following five classes.[3] [4] [5] [6] [7] [8]
Concentric Loss
This visual defect involves loss of vision in an annular region in the eye. Among the patients with concentric restriction of visual field, the most common disorders include nyctalopia (night blindness), caused by widespread loss of rod function and tapetoretinal degeneration. One of the problems with this type of visual defect is it is often noted only after the defect has developed into an advanced stage because numerous compensation strategies are used by the patients. The following images show possible forms of concentric losses.

Central Vision Loss
Tunnel Loss refers to loss of vision in the central area of the visual field. Macular Degeneration is one of the most common causes of this kind of visual defect. It generally affects elderly population but can affect young people in the form of Stargardt's disease, Best's disease, Inverse Retinitis Pigmentosa or such others.
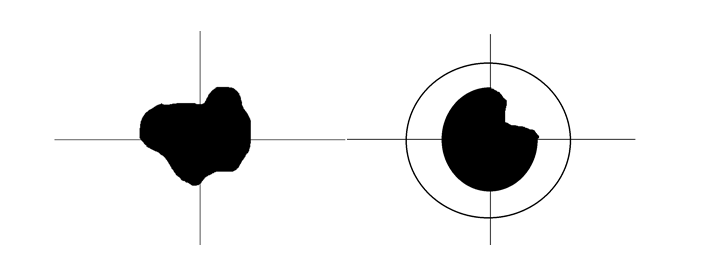
Tunnel Vision
Tunnel vision is the constriction of visual field, resulting in the loss of peripheral vision with retention of central vision, sometimes creating a sensation of seeing through a narrow tube like a tunnel. Glaucoma, severe catracts, retinitis pigmentosa and eye strokes are some of the major causes leading to this kind of defect. Other causes can include brain damage, neurological damage such as optic neuritis, concussions and such others.
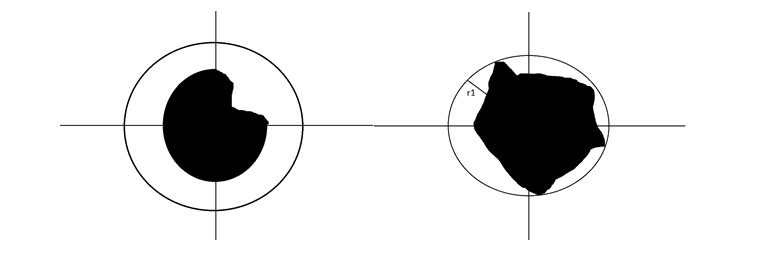
Sector Loss
We define sector loss to be lack of vision in a wedge-shaped area in the visual field, where the peak of the sector points towards the center of the visual field. Disturbances of choroidal blood supply are likely causes of this type of visual defect.
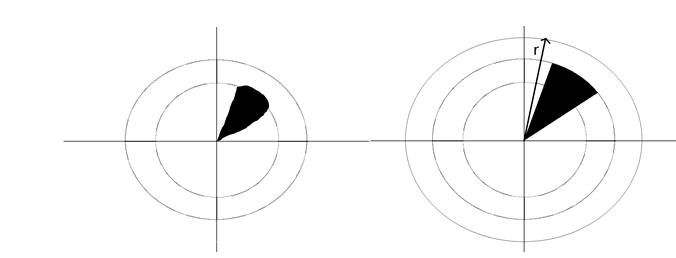
Off-centered Patch
We call off-centered patch to be degeneration of vision in a region of the visual field not involving the center of vision. This type of defect is possible because scotomas do not always occur in the center of vision. Glaucoma, Macular Degeneration, Diseases of optic brain, optic tracks can result in scotomas, which could be off-centered.
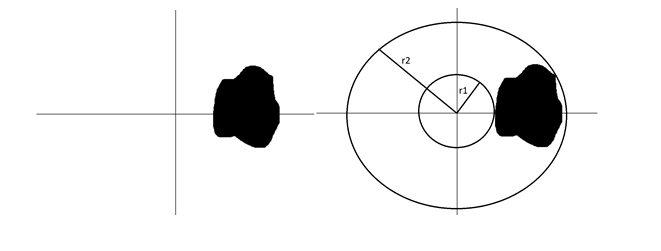
Proposed Algorithms
We propose two algorithms for performing the perimetry tests in an efficient manner. We name the first algorithm as Circular Linear Scan (alternatively called Keyboard Trace algorithm, since the responses of the patients are recorded through keyboard for tracing out the visual field), as it involves performing a scan using a circular stimulus followed by moving the stimulus in a linear fashion. The second algorithm is mouse-tracking algorithm (also called mouse trace algorithm as the mouse pointer is used to record inputs by the patient to trace out the estimate of the visual field), where the patient moves a mouse pointer across and indicates by a click when the mouse pointer becomes invisible
Circular Linear Scan
The algorithm has two major steps. The first step involves starting with the largest possible circular stimulus and decreasing its radius to the minimum possible value. At each stage, the patient indicates if a circle is fully visible or partially visible or completely invisible. The second step involves moving a point stimulus along a ray at different angles starting from the center. We record the locations at which the point becomes visible after being invisible or vice-versa. The response of the patient from the two steps are then combined to get an estimate the visual field.
Circular Scan
- Start with the circle of largest possible radius
- Keep reducing the radius of circle till the minimum possible radius and record the response of the patient at each step
- The possible reponses of the patient include
- Fully visible - The entire circle is visible (we will denote this respnse by F)
- Partially visible - Only a part of the circle is visible (we will denote this response by P)
- Invisible - No portion of the circle is visble (this response is denoted by I)
Linear Scan
- Scan the field linearly along different angles, starting from the center by moving a point stimulus
- Record the locations where the patient indicated the point stimulus becoming invisible after being visible or coming into visibility after being invisible
Determining the type of Visual defect
Once we have recorded the user response, we first determine the type of visual defect, and then generate the estimate of the visual field. The type of visual defect can be determined from the responses to the circular scan part of the algorithm in the following manner.
- Record the patient's response as the radius of the circle is reduced from the largest possible value to least possible
- Now we have an array of responses, each element of the array corresponds to either 'F', 'P' or 'I'
- If two consecutive elements in the sequence are same, merge them and replace them by one
- Repeat the above step till no further reduction is possible
- For example, if the array is [F,F,F,P,P,I], the final reduced array is [F,P,I]
- If the final reduced response sequence is (F,I,F), (F,P,I,F), (F,P,I,P,F), (F,I,P,F), then the patient is suffereing from concentric loss
- If the final reduced response sequence is (F,I), (F,P,I) then the patient is suffereing from central vision loss
- If the final reduced response sequence is (I,F), (I,P,F) then the patient is suffereing from tunnel vision
- If the final reduced response sequence is (F,P), (P) then the patient is suffereing from sector vision loss
- If the final reduced response sequence is (F,P,F), (P,F) then the patient is suffereing from off-center visual loss
Estimating the perimeter of Visual field
Determining the visual field estimate from linear scan varies slightly based on the defect type. The final visual field estimate is generated from the set of locations recorded based on the patient's reponse.
Linear Scan for Concentric Loss
- From the circular scan, we know r1 and r2
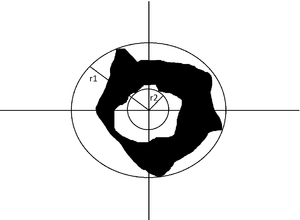
- Move the dot along different angles starting from the corresponding point on the circle with radius r2
- For every ray, record the position where the dot becomes invisible after being visble and vice-versa
- Stop scanning along a ray when the dot hits a circle of radius r1
Linear Scan for Central Vision Loss
- From the circular scan, we know r1 and radius of the largest circle within which there is no vision at all (let's call its radius as r2)
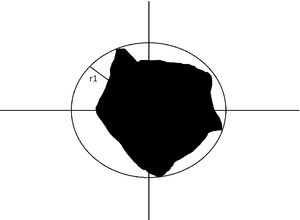
- Move the dot along different angles starting from the corresponding point on the circle with radius r2
- For every ray, record the position where the dot becomes invisible after being visble and vice-versa
- Stop scanning when the dot hits the circle of radius r1
Linear Scan for Tunnel Vision
- From the circular scan, we know r1 and radius of the smallest circle beyond which all points are completely invisible (let's call its radius as r2)
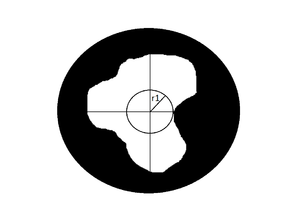
- Move the dot along different angles starting from the corresponding point on the circle with radius r1
- For every ray, record the position where the dot becomes invisible after being visble and vice-versa
- Stop scanning along a ray when the dot hits the circle of radius r2
Linear Scan for Sector Vision Loss
- From the circular scan, we know the radius of the smallest circle beyond which all points are completely visible (let's call its radius as r1)
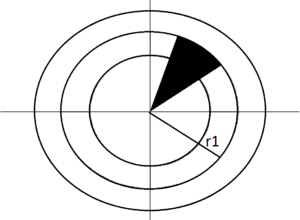
- Move the dot along different angles starting from the center
- For every ray, record the position where the dot becomes invisible after being visble and vice-versa
- Stop scanning along a ray when the dot hits the circle of radius r1
Linear Scan for Off-centered Patch
- From the circular scan, we know r1 and r2
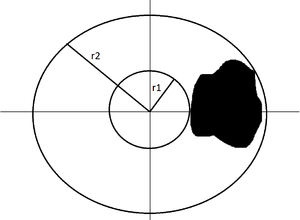
- Move the dot along different angles starting from the corresponding point on the circle with radius r1
- For every ray, record the position where the dot becomes invisible after being visible and vice-versa
- Stop scanning along a ray when the dot hits the circle of radius r2
Optimizating the Circular Linear Scan
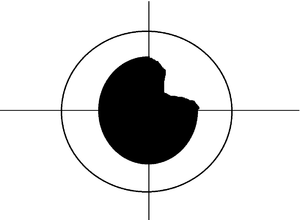
We observed that we can make the linear scan part of the algorithm more efficient if we record additional information from the patient, which is to take note of the quadrants in which the circle is completely visible and in which it isn't, whenever the patient indicates parital visibility of the circular stimulus. We designate V as the set of quadrants where the circle is completely visible and N as the set of quadrants where the circle isn't completely visible. We apply the following optimization for different types of visual defects.
Central Vision Loss
We scan more finely in the quadrants in V. This results in a better estimate of the visual field. Also to improve the speed of the algorithm, we can perform a coarse scan in the set of quadrants stored in N.
Tunnel Vision
We scan nicely in those quadrants given by N and coarsely for the quadrants in V to make the algorithm faster and to achieve better accuracy in the estimate.

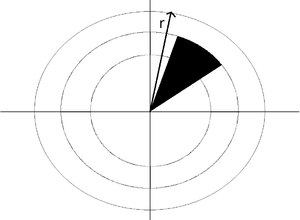
Sector Vision Loss
We scan finely in those quadrants given by N and coarsely for the quadrants in V. We stop scanning if all points in a given ray were visible after invisible points were recorded (like ray r in figure assuming scanning in anti-clockwise direction).
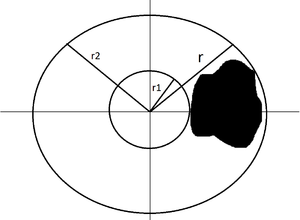
Off-centered Patch
Similar to sector loss, we scan nicely in quadrants in N and stop scanning if an entire ray is visible after invisible points are recorded (like ray r in figure).
Mouse Tracking
Mouse Tracking is a quick and dirty way to get a rough estimate of the visual field. The patient moves the mouse pointer across the field and indicates by lef-click if the mouse pointer becomes invisible. The set of locations of all the points clicked gives us an estimate of the visual field. The lack of accuracy in this case can be attributed to the fact that the patient is moving the pointer.
Implementation
We implemented our algorithm using Psychtoolbox for Matlab in Mac OSX. Psychtoolbox is a free set of Matlab and GNU-Octave fuctions for vision and neuroscience research. It comes equipped with general VR HMD support infrastructure, with a driver specifically for the Oculus Rift DK1 and DK2. We used the Oculus Rift DK2 for rendering the test.
Circular Linear Scan
For the first part of the algorithm, we changed the radius of the circular stimulus from the maximum possible radius of 400 (which covers the entire oculus screen) to the minimum possible radius of 20 in steps of 10. That is, we reduce the radius of circle by a value of 10 at every iteration. For the linear scan part, we changed the angle each time by 10 degrees when scanning finely and by 16 degrees when scanning coarsely. We recorded the responses of the patient using inputs from the keyboard. The patient has the option to change his reponse in case he/she feels so before recording the final response. Using the final set of locations of recorded points the visual field was estimated.
Mouse Tracking
The patient moved the mouse across the field and indicated by the left-click if the mouse pointer became invisible. The end of test is indicated by the press of right-click button. The location of each click is recorded. The final set of stored locations give an estimate of the visual field.
Results
Since we could not test the algorithm on real patients, we simulated different visual defects by creating a background image with different patches and performed the test on overselves. The following histogram depicts the time taken to perform the test for different kinds of visual defects using Circular and Linear Scan and Mouse Tracking.
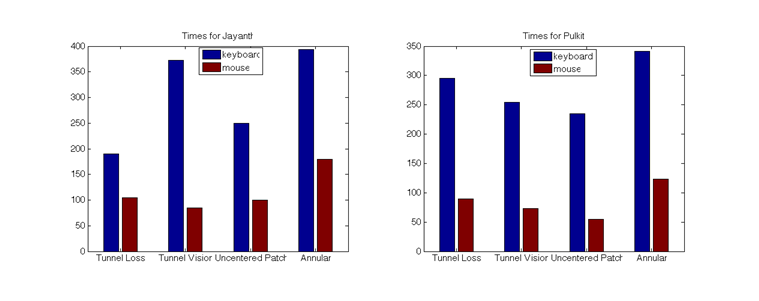
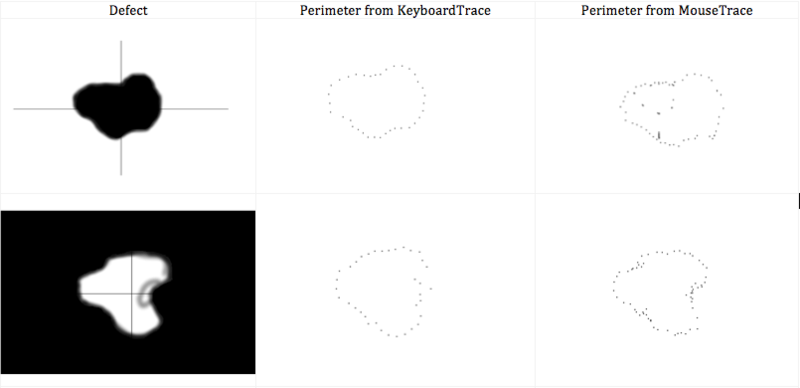
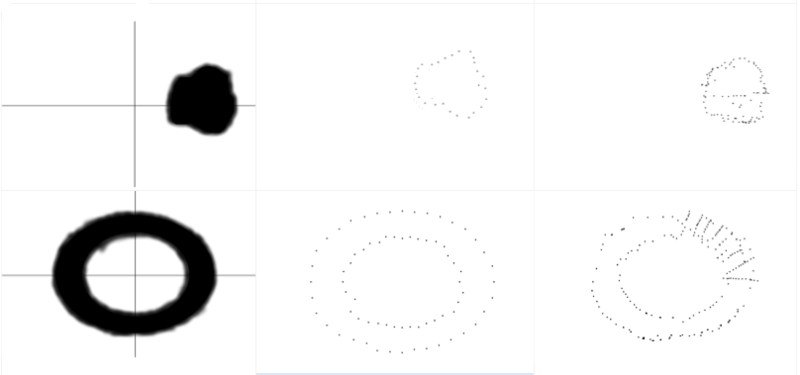
Current perimetry tests can take upto 22 minutes to estimate the visual field for an eye, whereas our perimetry test took about 4 minutes on average to perform using Circular Linear Scan and about 1 minute using the Mouse tracking method. The following figure shows the estimate using both the algorithm for different kinds of defects.
Future Work
The project describes and implements efficient algorithms for estimating the visual fields of patients suffering from various visual defects. Future work in this area could be along the following lines -
- Automation of our algorithm to reduce the test time
- Extension of the test to present stimuli of varying intensity and colour
- Optimization of the algorithm for the case of multiple patches of vision degradation
Conclusion
In this project, we developed an efficient algorithm to estimate the visual field of patients suffering from different kinds of complications like glaucoma, macular degeneration, Retinitis pigmentosa, Stargardt's disease, Best's disease, Inverse Retinitis Pigmentosa which could lead to different kinds of visual defects. Currently, we have implemented our algorithm using Psychtoolbox for Matlab in Macbook Pro, which we integrated with a calibrated Oculus Rift Development Kit 2. We have reduced the time taken to complete perimetry tests significantly and also developed the tests in a manner so that the patient is actively involved in the test. We presented an optimzed version of the algorithm for single patches of vision loss. However, our algorithm could be optimized for the case of muliple patches of vision loss in patients. The test can also be automated to make it faster.
References
[1] https://en.wikipedia.org/wiki/Visual_field_test
[2] http://eyewiki.aao.org/Standard_Automated_Perimetry
[3] Schiefer, U., J. Pätzold, and F. Dannheim. "Konventionelle Perimetrie." Der Ophthalmologe 102.6 (2005): 627-646.
[4] Kedar, Sachin, Deepta Ghate, and James J. Corbett. "Visual fields in neuro-ophthalmology." Indian journal of ophthalmology 59.2 (2011): 103.
[5] http://www.retina-international.org/eye-conditions/symptoms-understanding/loss-of-central-vision/
[6] https://en.wikipedia.org/wiki/Tunnel_vision
[7] http://www.allaboutvision.com/conditions/peripheral-vision.htm
[8] http://www.sw.org/HealthLibrary?page=Scotoma
Acknowledgements
We are extremely grateful to Trisha Pei-Wei Lian and Cordelia for mentoring us in this project. We also thank Prof. Brian Wandell and Prof. Joyce Farrell for all the support and help they extended to us during the course of the project.
Appendix I
The code used for the project can be found here Code
Appendix II
The algorithm for the project and the code for the project were jointly developed by Jayanth Ramesh and Pulkit Agrawal. All the work was done jointly and there was no specific demacration of work for the project.