Thermal Imaging and Pitvipers
Introduction
Electromagnetic radiation refers to traveling oscillations in the electric and magnetic fields. The name “electromagnetic radiation” has about nine syllables too many, so in physics it is often simply called “light”. Light can be categorized based on the portion of the electromagnetic spectrum it resides in (e.g. “visible light”) or it can be categorized based on its source (e.g. “laser light”). In this report we will refer to two regions of the spectrum - the “visible” and the “infrared”. The visible region is the portion our eyes can see and consists of wavelengths 400 - 700 nm. The infrared region is everything between the visible and microwave portions of the spectrum, or wavelengths roughly from 700 nm - 1 mm. We will focus on light generated by the thermal motion of particles, which we call “thermal light”.
Although different portions of the electromagnetic spectrum often are treated as completely separate, we will show here that both the visible and infrared are used by animals for vision. Our goal is to understand the components fundamental to imaging in these two wavelength regions and to connect the animals’ vision to today’s technology.
We first briefly introduce the origins of thermal light. Then we will discuss the evolution of vision in animals to both the visible and the infrared, before comparing the two and noting the implications for human camera technology in the two regions of the spectrum.
Background
Scientists observed that warm things emitted light, and then tried to model it. In 1900 Max Planck was shown data on the spectrum of thermal light, and the same day guessed a formula that modeled it. He started with the answer and then worked backwards to explain it, changing any physics that disagreed along the way - in doing so he invented the Boltzmann constant and also quantized the energy levels of the light - marking the very beginning of quantum mechanics [Hollandt 2012]. His equation for the spectrum of thermal light emitted by an object at temperature T is [Planck 1910]
![]()
There are no geometrical terms here - the object is assumed to be a “blackbody” that perfectly absorbs all incident light, and thus also perfectly emits thermal light. Most everyday objects are not perfect absorbers, but instead are partially reflective. We can model these “greybodies” by multiplying the blackbody spectrum by the emissivity - a number between 0 and 1 that represents how absorptive or emissive the object is. In general, the emissivity depends on wavelength and angle, but oftentimes an average emissivity is sufficient.
By integrating the greybody intensity spectrum we find that the power of thermal radiation scales with temperature to the fourth power times the emissivity:
 , which for a constant emissivity is simply
![]()
To summarize, everything emits thermal light, with a spectrum and radiance that depends on material and temperature. The sun has a temperature of about 6000 K and emits light with a peak wavelength in the visible around 500 nm. Everything at earth-scale temperatures near 300 K emits in the infrared with a peak wavelength around 10 um. These two sources - the sun and everything on the earth - define the two wavelength regions useful for vision.
Vision in Animals
Most animals need to perceive their environment in order to find food and avoid predators. Animals evolved the ability to sense light from the environment, multiple times, in order to better perceive the environment. In this section, we will discuss two different kinds of vision in the animal kingdom. First, we talk about vision with visible light, which detects the reflections of sunlight off the surroundings. Then we talk about vision with infrared light, which detects the thermal light emitted by the surroundings.
Visible
Vision first evolved about 500 million years ago during the Cambrian period, a time when all life was underwater. It is thought that the first eyes consisted of photoreceptors and had only light/dark sensitivity. Gradually, some eyes became dimpled to form pinhole cameras and therefore acquired spatial resolution. The pinhole aperture eventually became sealed by a cornea and the lenses we know and have today evolved. Some animals, however, never evolved lensed eyes and remain virtually unchanged since the Cambrian. The nautilus is one such living fossil that provides a glimpse of what some early eyes looked like.
 The Chambered Nautilus (Source: Monterey Bay Aquarium)
Nautilus eyes consist of a 1 mm diameter pinhole opening up to a roughly 10 mm diameter cavity. The back of the cavity is lined with photoreceptors with a peak sensitivity to blue light at 465 nm, which makes sense given that only blue light reaches the 100+ meters of depth where the nautiluses live.
 Cross sections of the nautilus' pinhole eyes. (Source: Raj 1984)
To understand the limits to Nautilus vision, let’s examine the angular and spatial resolution of pinhole eyes.The visual resolution of pinhole eyes is a combination of the aperture size (D) and its distance from the retina (h). The geometrical blur of a large aperture is given by and the diffraction blur (Airy disk half angle) is given by . We can also project the angular resolution onto the back of the retina to get the spatial resolution from the spot size . The intensity of light on the detector is a fraction of the ambient intensity , so therefore there is a direct tradeoff between resolution and sensitivity. To summarize, larger apertures increase blurring due to the aperture size, decrease blurring due to diffraction, and increase the amount of light collected.
The pinhole eyes of the nautilus have large apertures. Plugging in and depth we find
Our estimated resolution is consistent with behavioral experiments on living nautiluses, which found their resolution to be between 5.5 and 11.25 degrees [Raj 1984]. Surprisingly, the photoreceptor spacing in the nautilus of 0.28 degrees is much smaller than the aperture limited spot size of 6.5 degrees. Some hypothesize that the extra photoreceptor density has no visual benefit. Another possible explanation is that the brain is able to post-process and correct for the geometric blurring due to the pinhole. We will revisit this idea in the next section, where we examine another creature with pinhole eyes.
Infrared
When animals first moved onto land about 500 million years ago, they entered a new sensory environment compared to the oceans. Unlike underwater, infrared waves propagate in air and carry additional information about the temperature of the surroundings. Temperature is particularly relevant to snakes since they thermoregulate with their surroundings, often prey on warm-blooded rodents, and often must avoid warm-blooded predators. When snakes evolved about 50 million years ago, some developed the ability to sense this infrared radiation and thus discern the temperature of their surroundings [Greene 1997].
Pitvipers are one such group of snakes that evolved a set of pits that function as pinhole eyes for seeing infrared light. The pits are roughly diameter and depth . Suspended just off the back lining is a 15 um thick membrane of receptors.
-
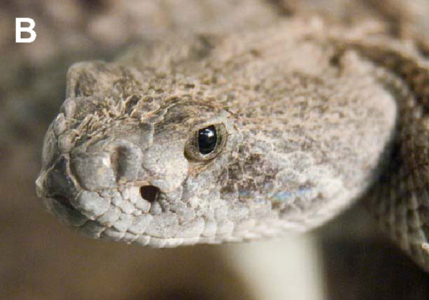 Close up of Western Diamondback Rattlesnake. Nostril, pit, and eye are visible. (Source: Bakken 2012)
 -
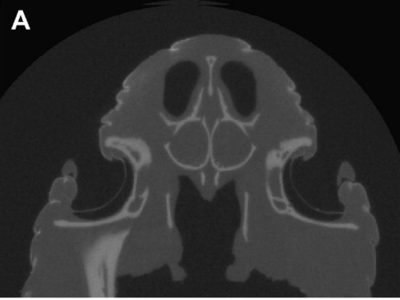 Xray cross section of Western Diamondback Rattlesnake. Note the thin membrane suspended near the back of the pit. (Source: Bakken 2012)


Instead of photoreceptors, the membrane contains temperature-sensitive nerves - similar to those humans have that tell if something is too hot or cold. Incident infrared light gets absorbed by water in the pit membrane, heating it up and leading to a change in temperature. Temperature differences in the scene are represented by differences in infrared light illumination, which when imaged by the pinhole onto the back of the pit membrane leads to measurable temperature differences across the membrane. Temperature changes as small as 0.002 C are detectable.
Based on the geometry of the pit, we find it's resolution to be
The roughly 7000 sensory cells of the pit form a sensor mosaic with spacing of about 60 um - much more densely packed than the 1 mm resolution we estimated above. One possible explanation for the oversampling by the receptor mosaic is that the brain can use the additional data to post-process and sharpen the blurred image [Hartline 1982]. To understand how postprocessing can help, consider the point spread function of a large pinhole. A single bright point source on a dark background will uniformly illuminate a circle on the pit membrane. The edges of the circle will be blurred by diffraction on the order of , and outside this the membrane will be in shadow. If the edges of the circle can be accurately determined, then the location of the point source can be accurately determined by inferring the circle’s center. This is the role of post-processing in the brain.
The brain combines and post-processes the sensory information from the eyes and forms a “visual map” from the raw “sensory map”. A single pixel (neuron) on the visual map consists of a combination of the outputs from many sensory pixels - the “receptive field” of that pixel. In mammals, the receptive field of a neuron is an excitatory center with an inhibitory surrounding ring [Kuffler 1953]. For pinhole eyes where all the information lies in the edge-detection abilities, each pixel on the visual map is formed by ring-like excitatory and inhibitory combinations of pixels from the sensory map. If the ring radius properly matches the pinhole radius, then it has been shown that this neural process can recover the scene quite well as long as there isn’t much noise in the sensory data. Noise is particularly important since a single noisy pixel on the sensory map will skew many pixels of the visual map [Hemmen 2006]. There is strong evidence that the snakes can perform this post-processing. The variance in strikes of a blinded pitviper to a warm object is less than 5 degrees - far better than the geometric-limited 30 degree resolution we estimated above [Hartline 1982].
-
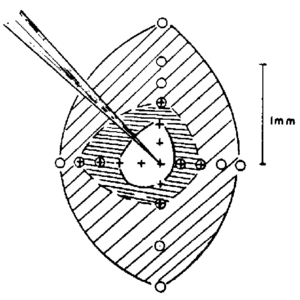 Measured excitatory center and inhibitory surround of the receptive field of a cat neuron. (Source: Kuffler 1953)
 -
 Simulated excitatory (yellow) and inhibitory (blue) rings of the receptive field of a pitviper with optimal post-processing. (Source: Hemmen 2006)
 -
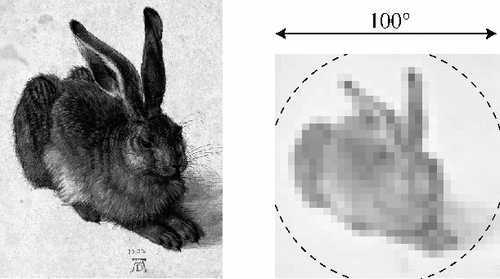 Input image for pit simulation: a scaled up rabbit filling the pit's field of view with 32x32 pixels comparable to the number of pit sensors. (Source: Hemmen 2006)
 -
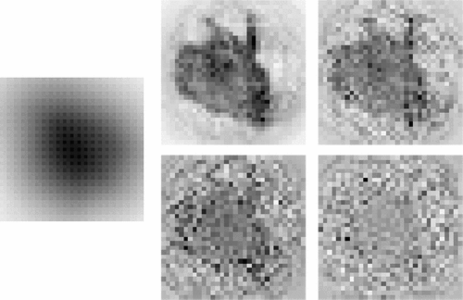 Left: Simulated resulting sensory map on the pit membrane. Right: recovered visual map, for various levels of sensory noise. (Source: Hemmen 2006)


The pits of pitvipers have many similarities and differences to the pinhole eyes of the nautilus.
Comparison
Let’s compare the visible-sensitive pinhole eyes of the nautilus with the infrared-sensitive pits of the pitviper. They evolved similar pinhole structures to detect the weak ambient light in their respective environments. However, they have different optical limits due to diffraction and different mechanisms for detecting light.
The geometries of the pinholes are similar between the nautilus and the pitviper. Both have large apertures that increase sensitivity at the cost of resolution. However, the surprisingly dense receptor mosaics of each animal suggest the possibility of post-processing in the brain that sharpens the blurred images formed in the pinhole. We know lenses can overcome the sensitivity-resolution challenge of pinholes and in humans we ourselves have lensed eyes. However, it is unlikely that pitvipers will ever evolve infrared lenses given that almost all organic materials absorb strongly in the infrared.
The effects of diffraction are different between the nautilus and the pitviper. The relevant wavelength of infrared light is about twenty times larger than that of the visible light, so therefore the diffraction effects are twenty times larger. However, the diffraction effects do not appear significant for neither the nautilus nor the pitviper due to the large apertures involved.
The detection of light is different between the nautilus and the pitviper due to the very different wavelengths involved. In the nautilus, visible light is absorbed by a specific molecule (a form of rhodopsin), which subsequently changes shape and triggers a chemical pathway that creates a signal from the retinal ganglion cells. The electron energy structure of the molecule determines what narrow range of wavelengths it is sensitive to. In the pitviper, however, no special molecule can be used because the quantum thermal fluctuations at room temperature would constantly activate it. Furthermore, no special molecule is needed because almost everything has a vibrational/rotational structure that strongly absorbs infrared light. The water (and almost everything else) in the pit membrane heats up when it absorbs infrared light, and the resulting temperature change then triggers a chemical pathway that generates neural signals to send to the brain.
Human Imaging Technology
The comparisons we noted in visible and infrared vision in animals also apply to visible and infrared vision in human technology. Lensed thermal cameras exist that can collect thermal light without having to deal with the sensitivity-resolution tradeoff inherent to pinhole cameras. The removal of geometric blurring allows diffraction to become the dominant challenge in resolution, and it is indeed true that the pixel size can be nearly 20 times larger in infrared cameras than visible ones which agrees with the fact that diffraction effects are about twenty times larger at those wavelengths in the infrared [Vollmer 2017].
Sensors in infrared cameras can also be quite different than sensors for visible cameras. Similar to pitvipers, many low-cost thermal imagers today detect temperature changes caused by the infrared light rather than detect the infrared light itself. High-cost thermal imagers, however, often use the same technology as visible cameras and the analogous “photon detector” of the nautilus. However, in order to avoid the quantum thermal noise they must operate in a shorter wavelength range and must be cooled to extremely cold temperatures (e.g. 77 K) [Vollmer 2017].
So far we have only discussed vision. Another key human technology that is necessary for autonomous driving is ranging. Additional benefits to ranging come with thermal light that are not possible with visible light. For example, multispectral thermal images provide sufficient information to separate material properties from temperature and thus infer depth during day and night [Bao 2023]. Another example is in how narrowband thermal light sources have extra intensity fluctuations that makes it possible to use them for a kind of ranging known as “random modulation continuous wave LiDAR” [Tan 2023].
Conclusions
Overall, we have compared animal vision in the visible and the infrared. There are many similarities and differences that carry over to human technology for imaging in the visible and infrared. The human technology is able to overcome some but not all of the challenges associated with imaging, and promises future advancements - for example in ranging for autonomous driving.
References
- M. Planck. Zur Theorie der Wärmestrahlung. Annalen der Physik, 336 (4) (1910), pp. 758-768.
- Hollandt, J. (2012). 125 Years of Research On and with the Black Body, Metrology Throughout the Ages, vol. 3, no.3, 87. PTB Mitteilungen.
- W. R. A. Muntz, U. Raj; On the Visual System of Nautilus Pompilius. J Exp Biol 1 March 1984; 109 (1): 253–263. doi: https://doi.org/10.1242/jeb.109.1.253
- HARRY W. GREENE. Snakes : The Evolution of Mystery in Nature. Berkeley: University of California Press, 1997. ISBN 9780520200142.
- George S. Bakken, Samantha E. Colayori, Taihung Duong; Analytical methods for the geometric optics of thermal vision illustrated with four species of pitvipers. J Exp Biol 1 August 2012; 215 (15): 2621–2629. doi: https://doi.org/10.1242/jeb.063495
- Newman, Eric A., and Peter H. Hartline. “The Infrared ‘Vision’ of Snakes.” Scientific American 246, no. 3 (1982): 116–27. http://www.jstor.org/stable/24966551.
- Sichert, A. B., Friedel, P. and Van Hemmen, J. L. (2006). Snake's perspective on heat: reconstruction of input using an imperfect detection system. Phys. Rev. Lett. 97, 068105. https://doi.org/10.1103/PhysRevLett.97.068105
- M. Vollmer, K Mollmann. Infrared Thermal Imaging: Fundamentals, Research and Applications. (2017). DOI:10.1002/9783527693306
- Bao, F., Wang, X., Sureshbabu, S.H. et al. Heat-assisted detection and ranging. Nature 619, 743–748, (2023). https://doi.org/10.1038/s41586-023-06174-6
- N. Takeuchi, N. Sugimoto, H. Baba, and K. Sakurai, "Random modulation cw lidar," Appl. Opt. 22, 1382-1386 (1983)
- Peng Kian Tan, Xi Jie Yeo, Alvin Zhen Wei Leow, Lijiong Shen, and Christian Kurtsiefer. Practical Range Sensing with Thermal Light. Phys. Rev. Applied 20, 014060, (2023)
- Lukashchuk, A., Riemensberger, J., Tusnin, A. et al. Chaotic microcomb-based parallel ranging. Nat. Photon. 17, 814–821 (2023). https://doi.org/10.1038/s41566-023-01246-5
- H. Cao, K. Kim, Y. Eliezer, and O. Spitz, "Parallel random LiDAR with spatial multiplexing," in Frontiers in Optics + Laser Science 2023 (FiO, LS), Technical Digest Series (Optica Publishing Group, 2023), paper FM1C.1.
Appendix I
lambda_vis = 500 * Helpers.nm; lambda_IR = 10*Helpers.um;
D_vis = 1*Helpers.mm; h_vis = 8.7*Helpers.mm;
D_IR = 1*Helpers.mm; h_IR = 2*Helpers.mm;
vis_or_IR = "vis"; % vis_or_IR = "IR"; if vis_or_IR == "vis" D = D_vis; h = h_vis; lambda = lambda_vis; else D = D_IR; h = h_IR; lambda = lambda_IR; end
theta_aperture = asin(D/(h)); % full angle of cone theta_diffraction = asin(1.22*lambda/D); % airy disk half angle (definitely correct
dx_aperture = h*sin(theta_aperture) % diameter of cone spot (on curved back lining) dx_diffraction = h*sin(theta_diffraction) % diameter
I_det_div_inc = 2*sin(theta_aperture/4)^2 % fraction of ambient intensity that makes it to detector (solid angle fraction)
theta_aperture_deg = theta_aperture*180/pi theta_diffraction_deg = theta_diffraction*180/pi